Ataques
Testing lab for Windows kernel exploitation: Getting into the depths of the OS

VP of Hacking
Actualizado
9 sept 2020
4 min
This post will be the first of a new series in which we will get deep into Windows Kernel Exploitation. I’ll be using HEVD (HackSys Extreme Vulnerable Driver) as the target and, just as we did with the Vulnserver series, there’s going to be a different articles on the ways to exploit it.
Before dealing with vulnerabilities, we must setup the lab environment first. Kernel exploiting is different than application exploiting. When you are attacking an application, if something goes wrong, you can simply restart it. In kernel mode, you will likely get an infamous blue screen of death BSOD.
This post will guide you to setup a testing lab for kernel debugging on a Windows 10 target machine and finally we will be able to install HEVD driver that will be our kernel space victim.
Pre-requisites
Unlike common user-land applications, the Windows Kernel is commonly debugged remotely. This is because, as I mentioned earlier, when you mess with kernel memory, you’re likely making the OS unusable. For that, we will setup a testing environment with a target Windows OS system (the debuggee) and some tools in the debugger machine.
The following are the tools needed to setup the environment:
WinDBG. We’ll use the version that’s included in the Windows 10 SDK
WinDBG dark theme (optional): Because I like fancy debugging
Pykd: To run Python scripts on WinDBG. Download here.
Windbglib + Mona: Download here
Windows 10 1703 (Creators Update): For now, we’d only need the 32 bits version
A virtual machine player. I’ll be using VMWare Workstation Player.
HackSys Extreme Vulnerable Driver: Our target. We’ll be using the latest stable release (
HEVD v3.00to the date of this post).OSR Driver Loader: To load
HEVDinto the OS. Download here
With all the requirements in place, we can start setting up our lab, which will be composed of a debugger machine, that will be the host machine from which we will run WinDBG; and the debuggee machine, on which we will install HEVD that will be running as a virtual machine.
Setting up debugger
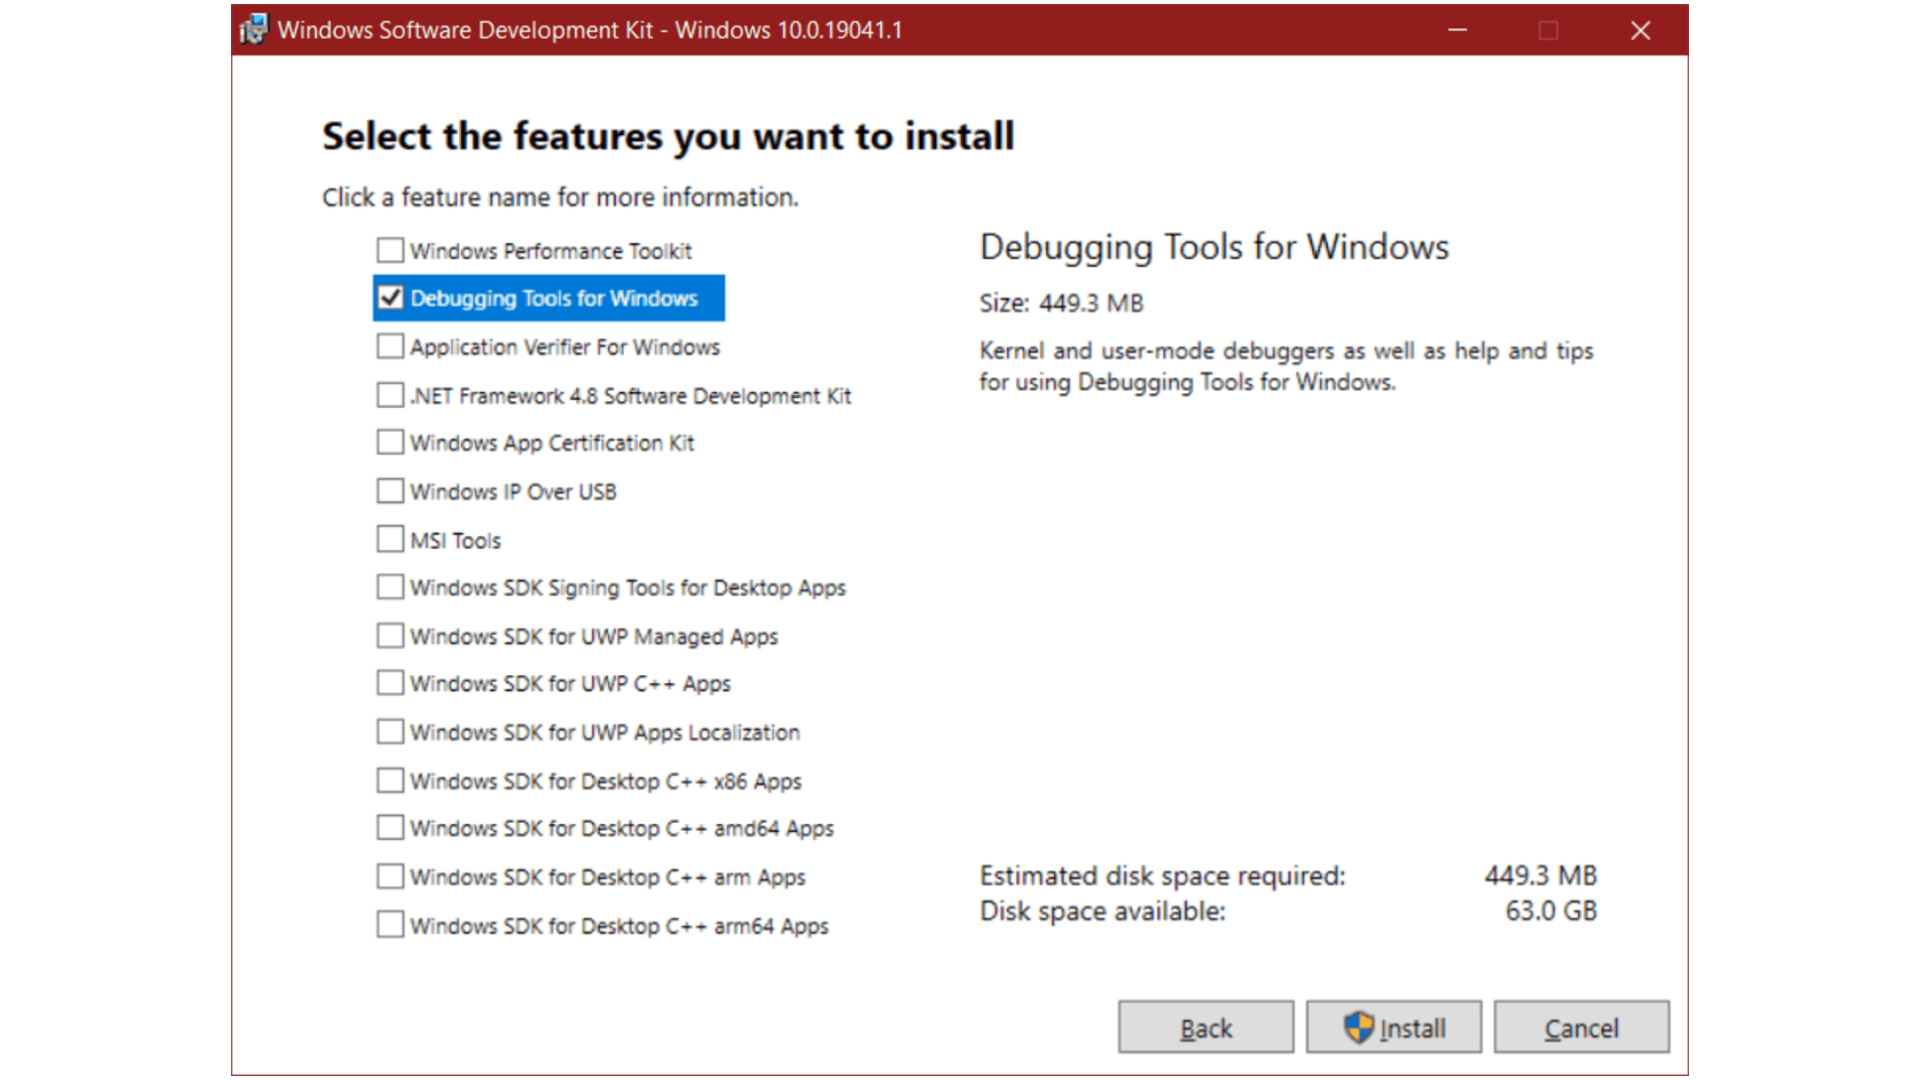
The first stage is to download and install the Windows 10 SDK. If you want to install only WinDBG, you can choose only the Debugging Tools for Windows option:
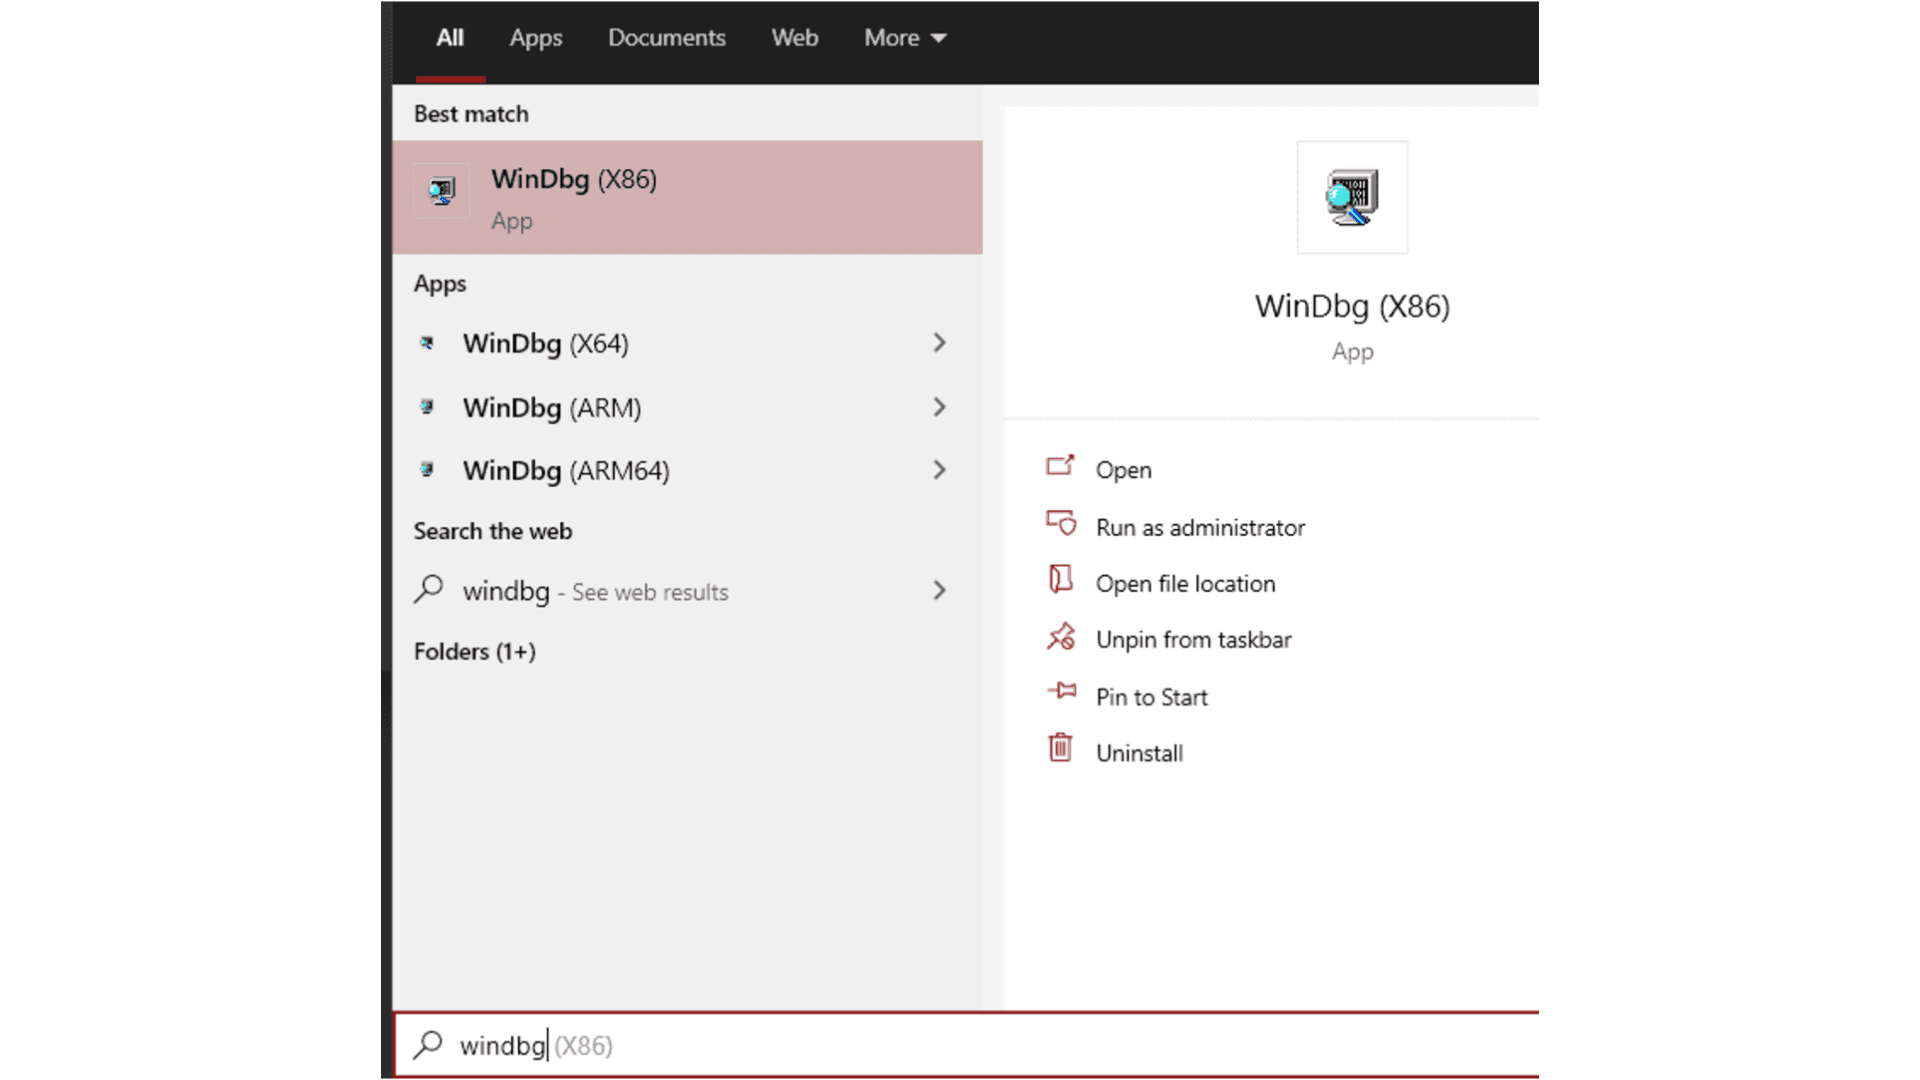
Once installed, if you search for windbg on Windows, you should get something like this:
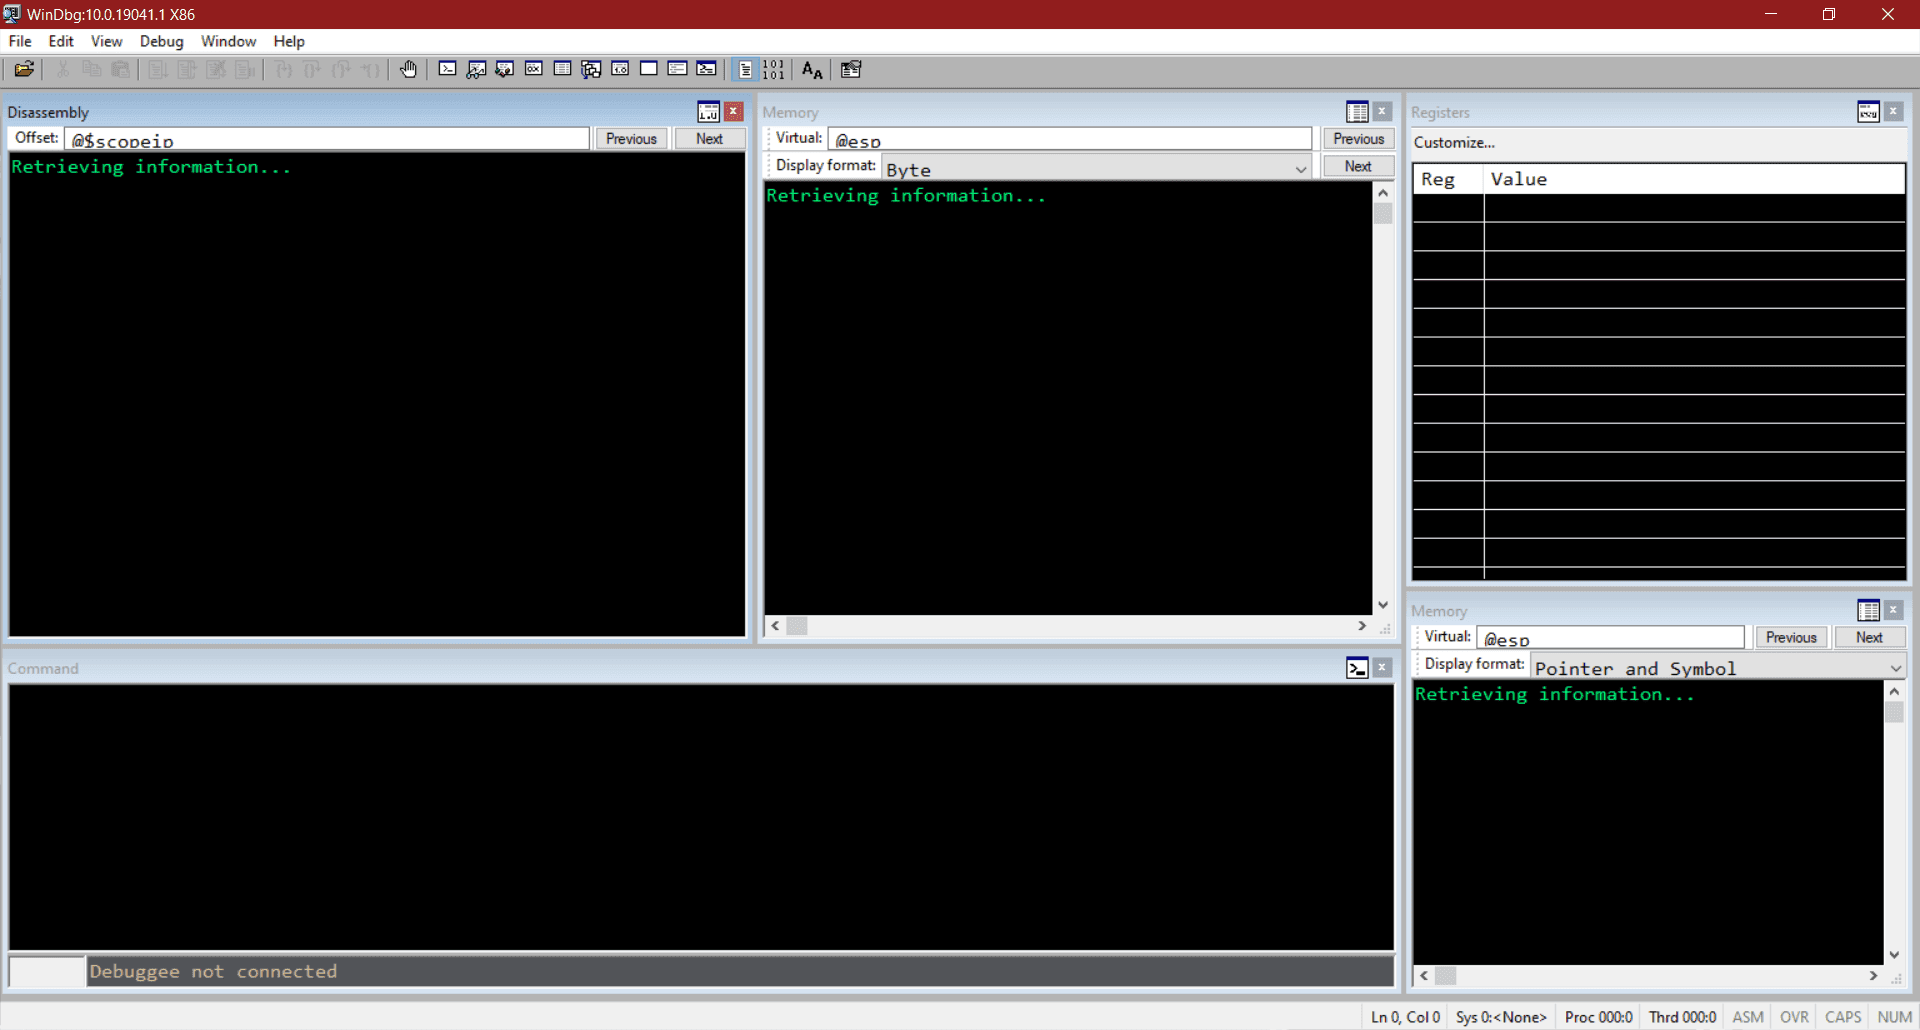
The default WinDBG configuration provides a not so friendly UI. However we can use a dark theme for WinDBG (see the Pre-Requisites section). To do that, just download the dark.reg file and install it. You will get a much friendly UI:
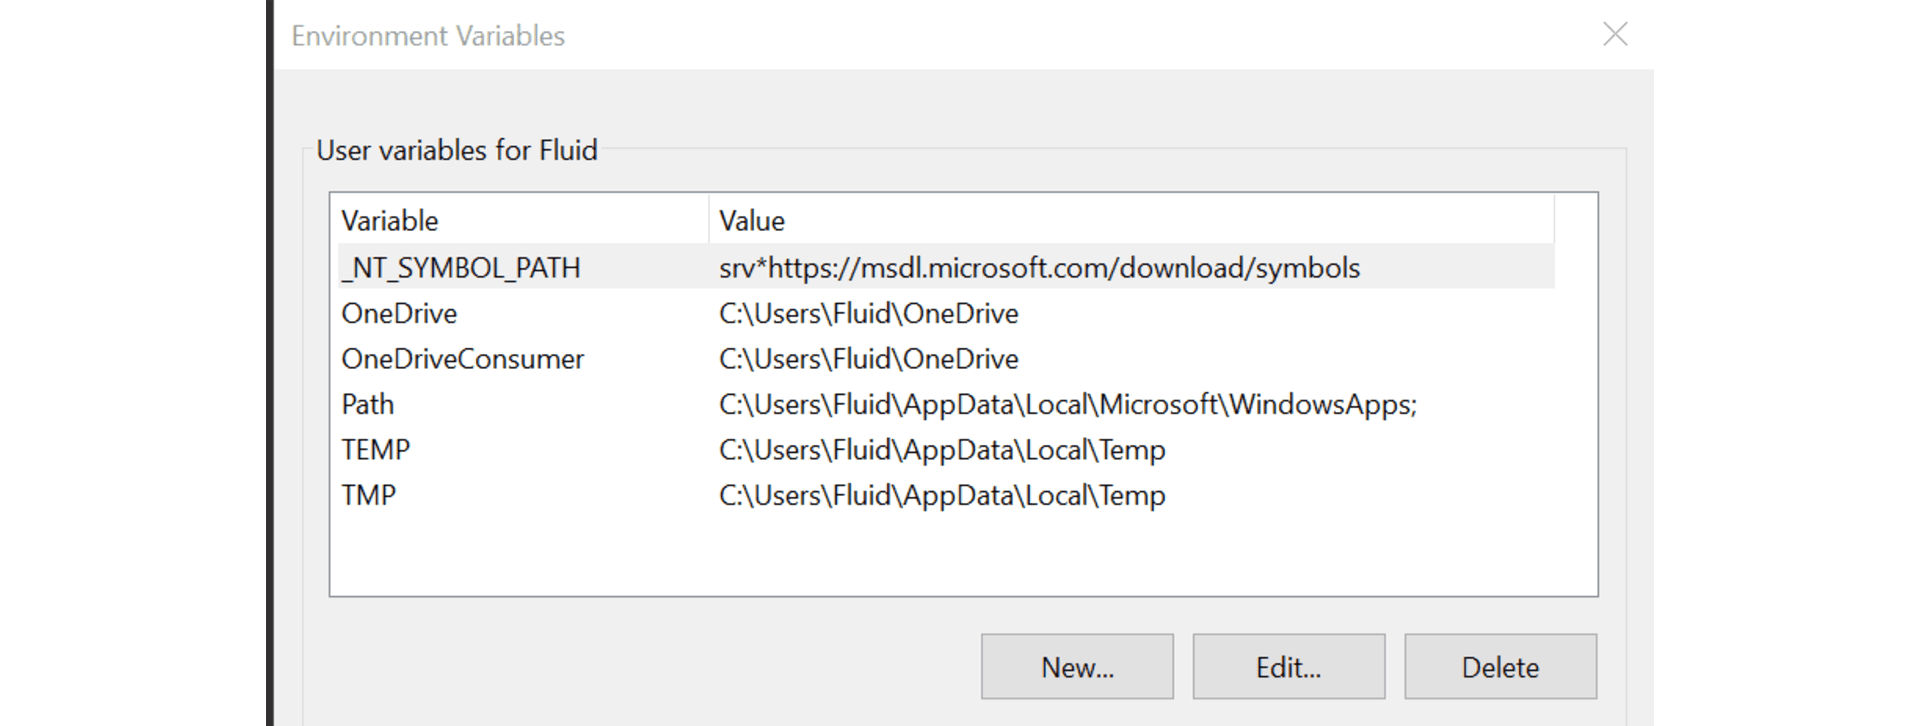
Next, we need to adjust the Windows symbols resolution. It is done by creating a new environment variable _NT_SYMBOL_PATH with the value srv*https://msdl.microsoft.com/download/symbols, like this:
Now, we need to install our friend mona. To do that, we need to grab the pykd.zip file located here.
That ZIP has two files. The pykd.pyd file should be placed at C:\Program Files (x86)\Windows Kits\10\Debuggers\x86\winext. Now run vcredist_x86.exe and follow the installing instructions.
Now, all that’s left is to download windbglib.py from here and mona.py from here and move them to C:\Program Files (x86)\Windows Kits\10\Debuggers\x86.
To check if that worked, load an executable on WinDBG, type .load pykd.pyd and then !py mona. You should see something like this:

With that, we have now debugger machine set.
Setting up the debuggee
Now it’s time to setup our target OS. The first thing is to launch a new virtual machine with a Windows 10 1703 (Creators Update) instance.
It’s recommended to disable Windows Update service to avoid messing with our lab results.
With the target machine up an running, it’s time to load HEVD in the system. This is done by copying the osrloaderv30.zip and HEVD.3.00.zip files to this target OS and uncompressed them. Then, we must run OSR Driver Loader (run the one in the WNET → i386 → FRE folder):
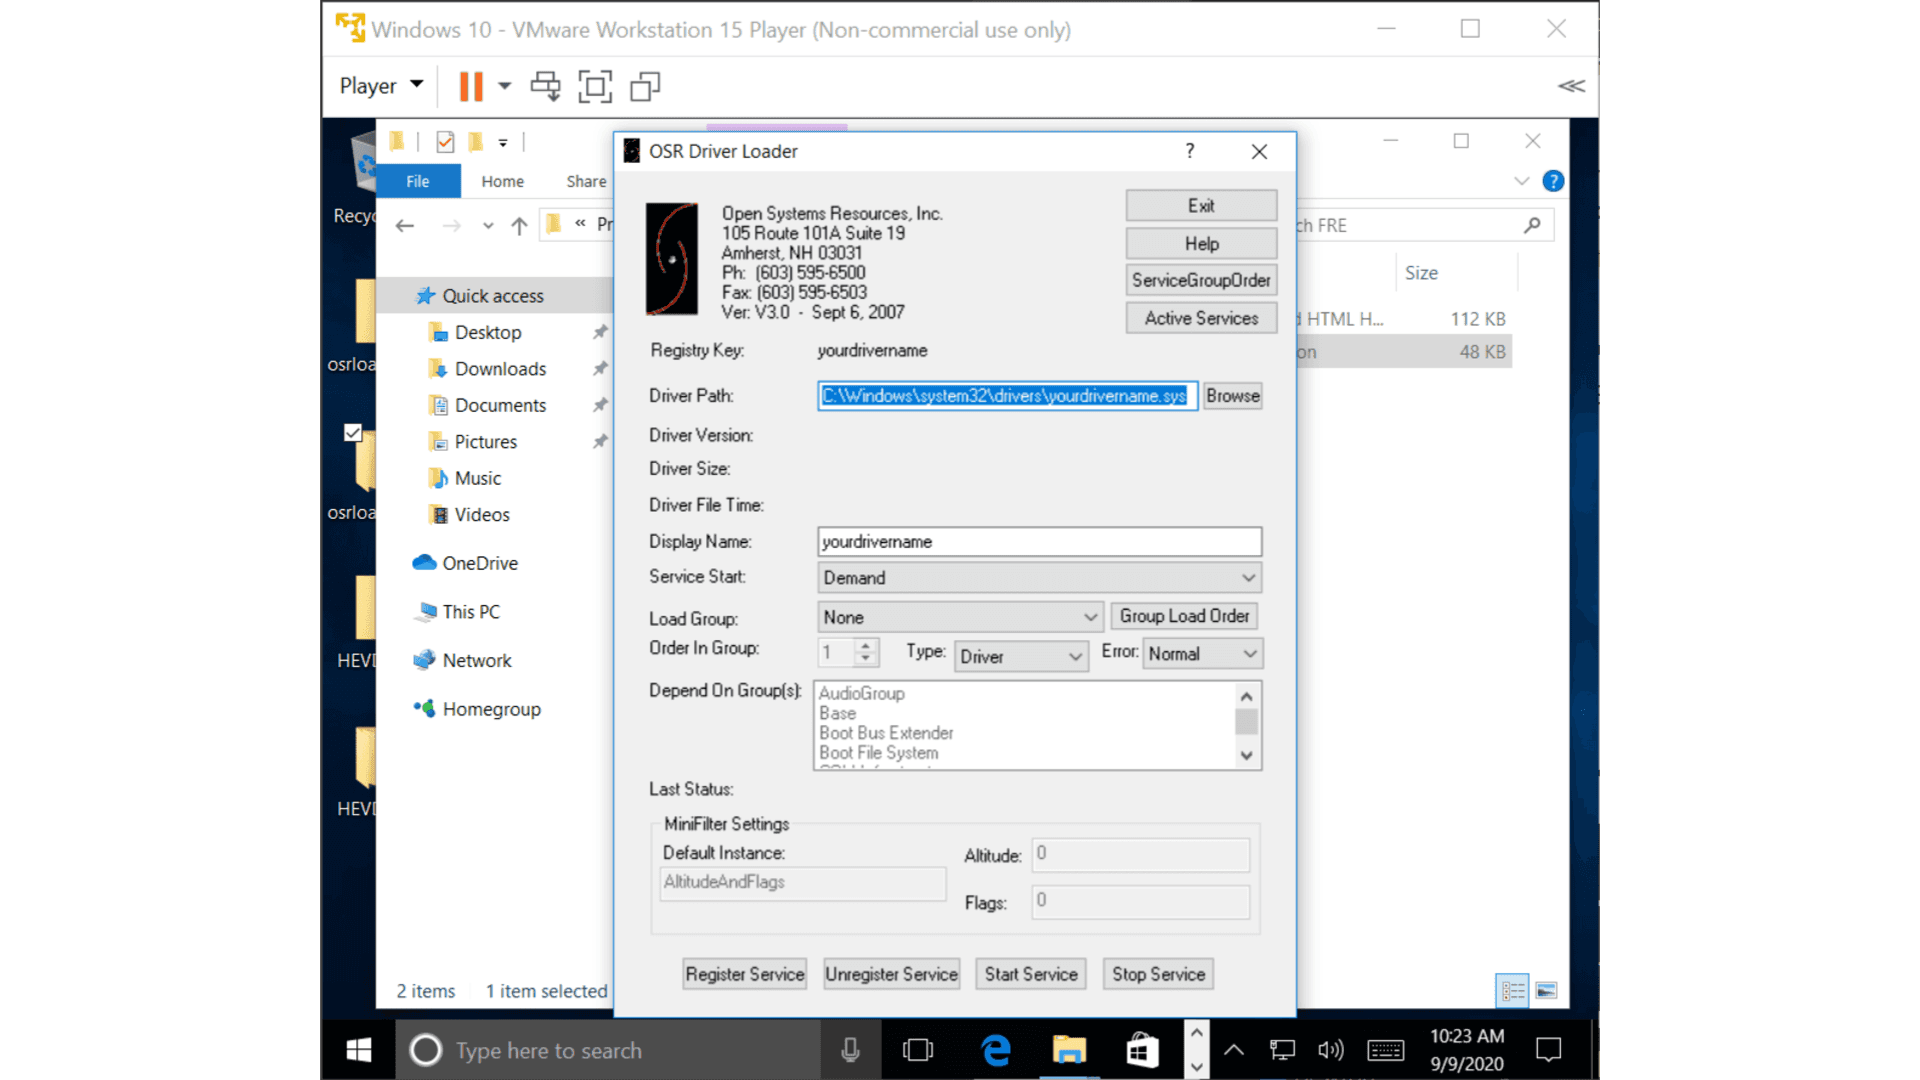
Now browse for the HEVD.sys file, click on Register Service and then Start Service:

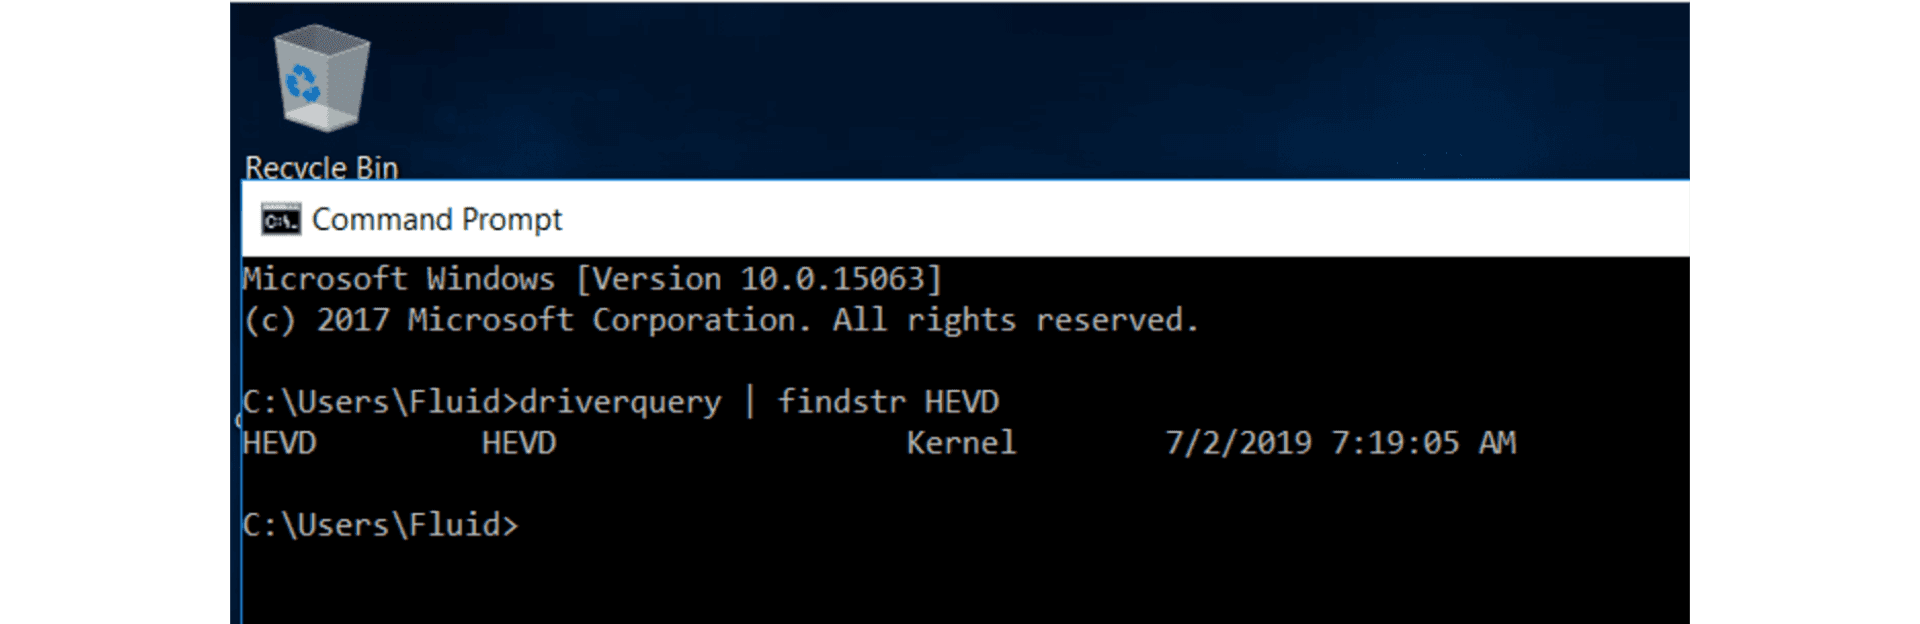
To check if that went well, open a terminal and type driverquery | findstr HEVD. You should see something like this:
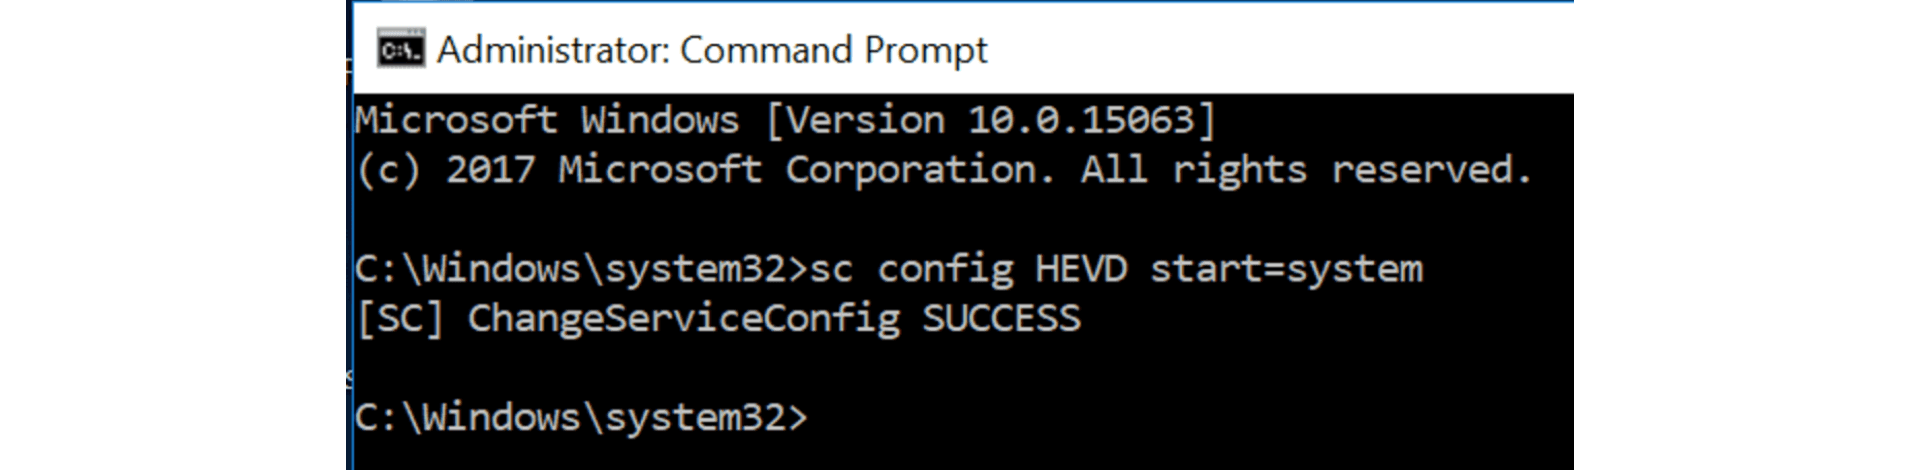
Great! To ensure that the HEVD driver is load every time, open a terminal as administrator and run
Now we must connect our target OS with the debugger. You need to launch a new terminal windows as administrator:
And then you need to enable remote debugging by issuing the following command:
You need to change the HOSTIP param with the IP of the debugger machine.
This will return a key that will be used for WinDBG to expect for a connection with that identifier.
In the debugger machine, setup WinDBG to listen for a connection with that key:
Now, we need to make Windows to start in DEBUG mode and restart. To that, we should issue the following command:
The target OS will restart and the debugger machine should now get a connection from the target OS:

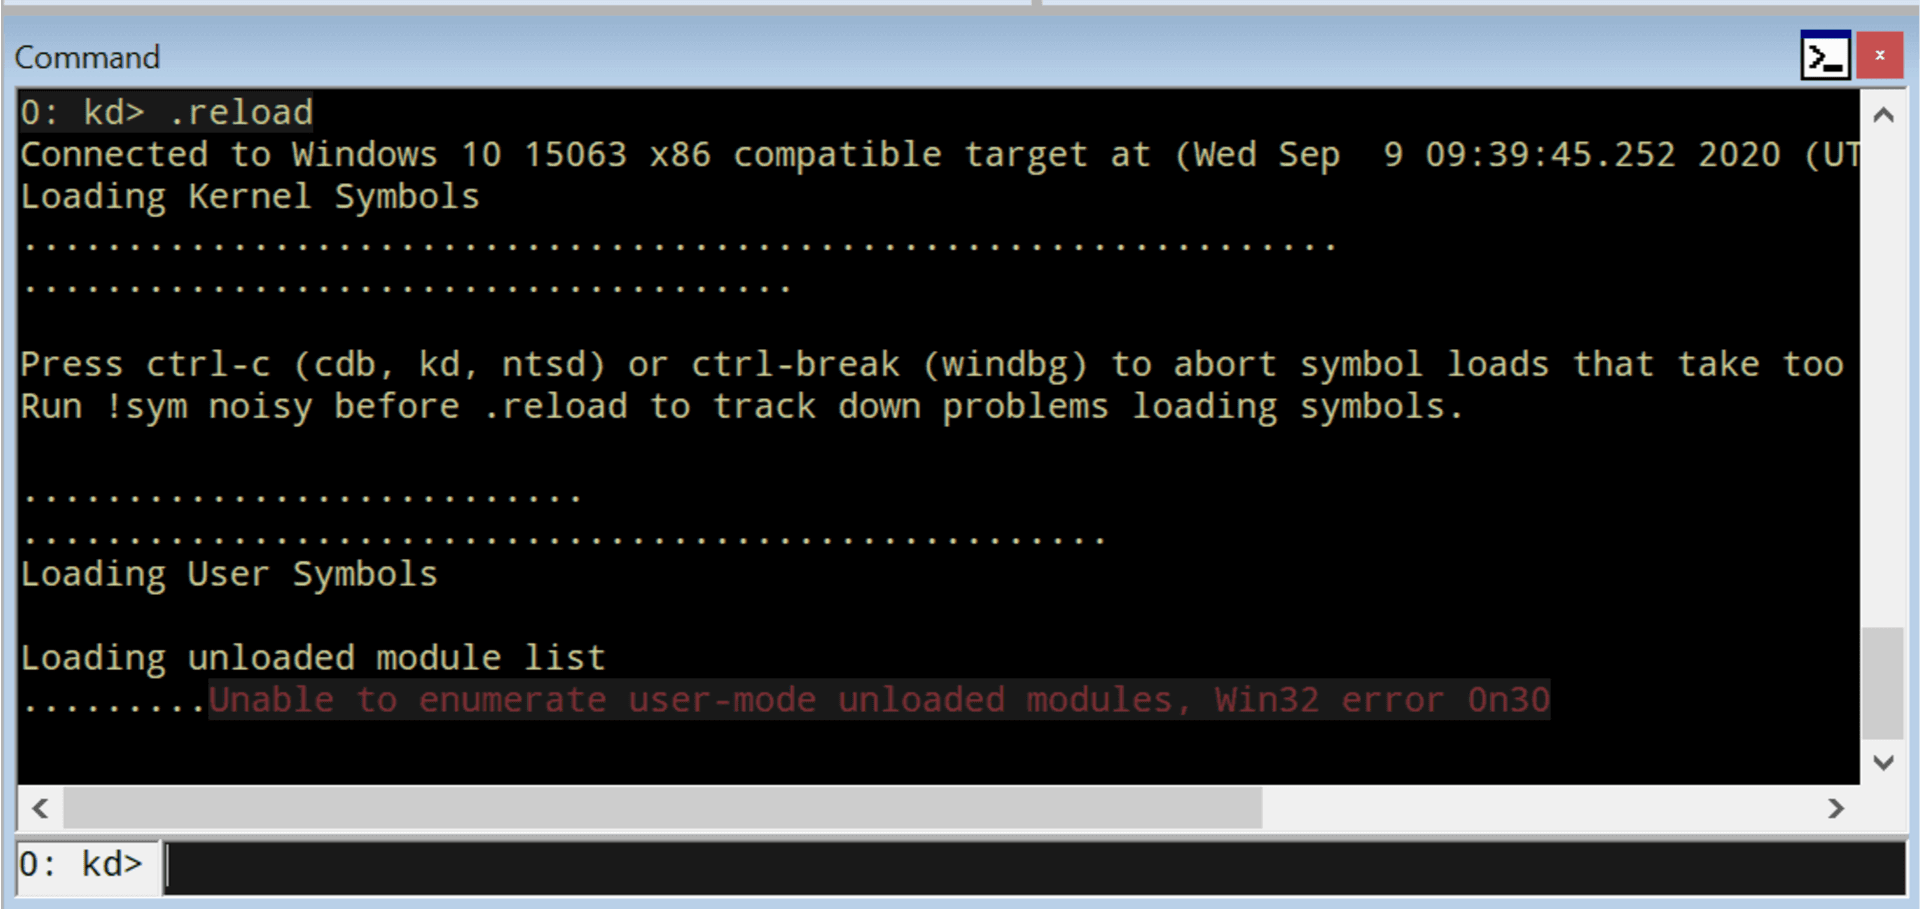
Great. Now break the execution (Debug → Break) and type .reload to load the debugging symbols:
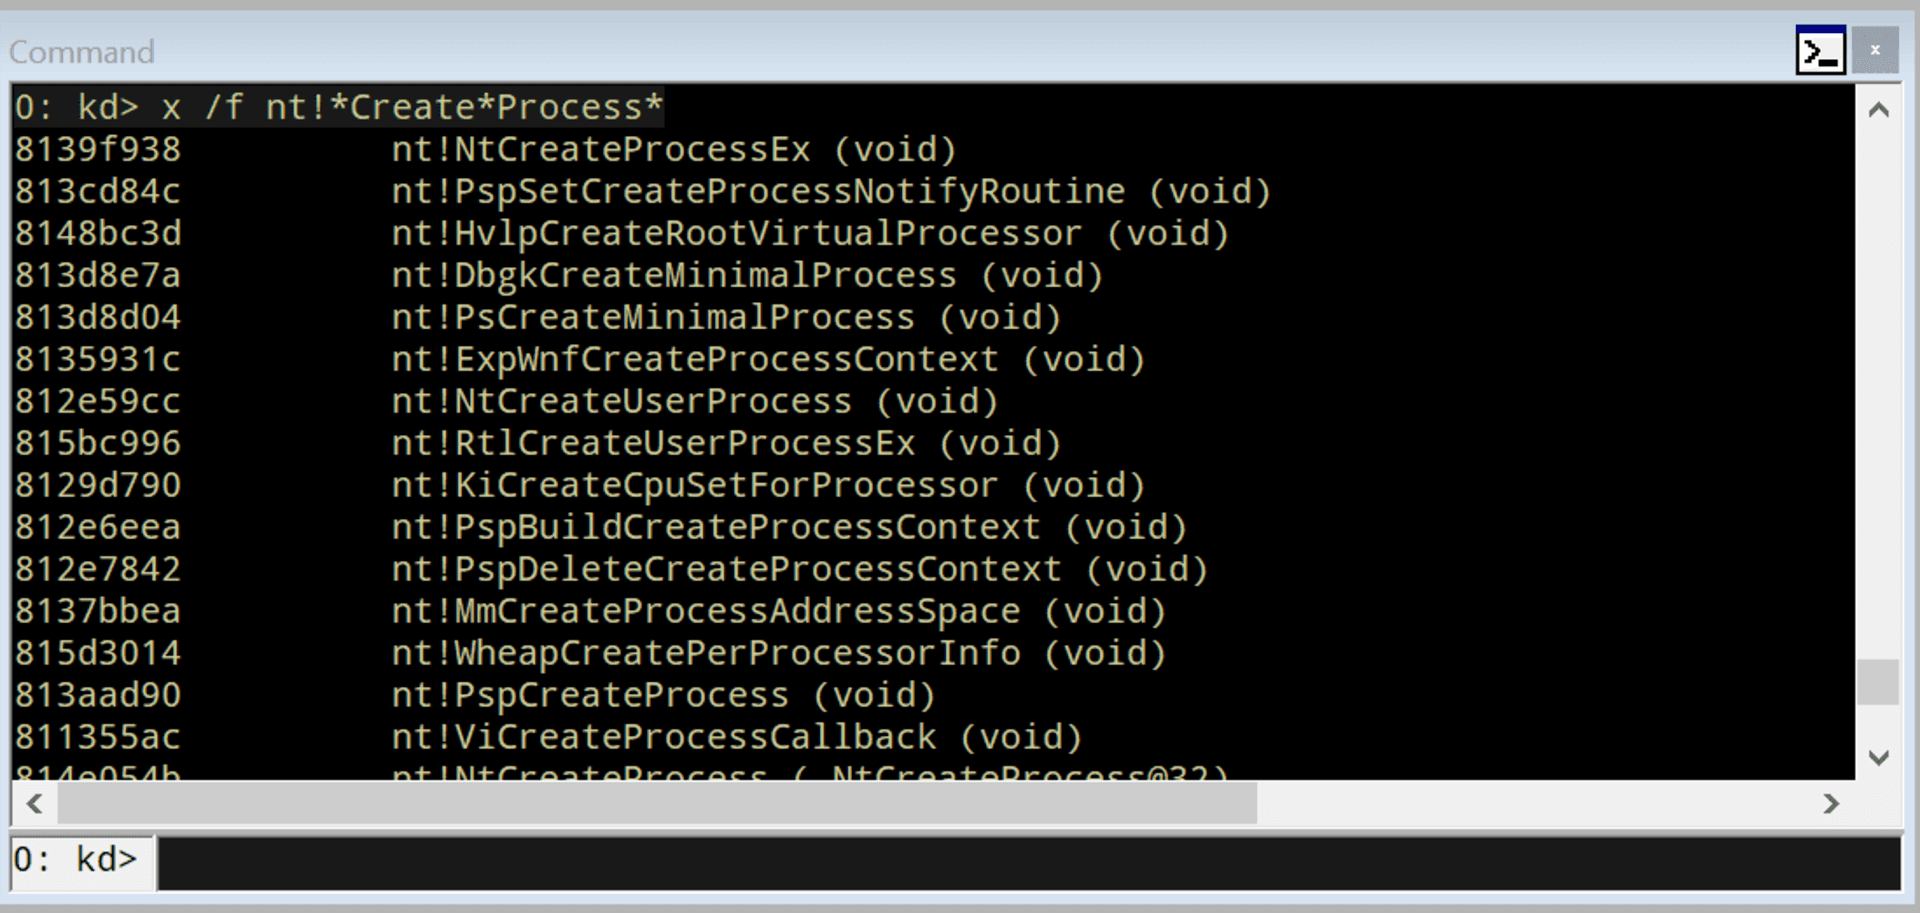
To check if everything’s working, type x /f nt!Create*Process. This will list all the functions in the NT module that contain Create and Process.
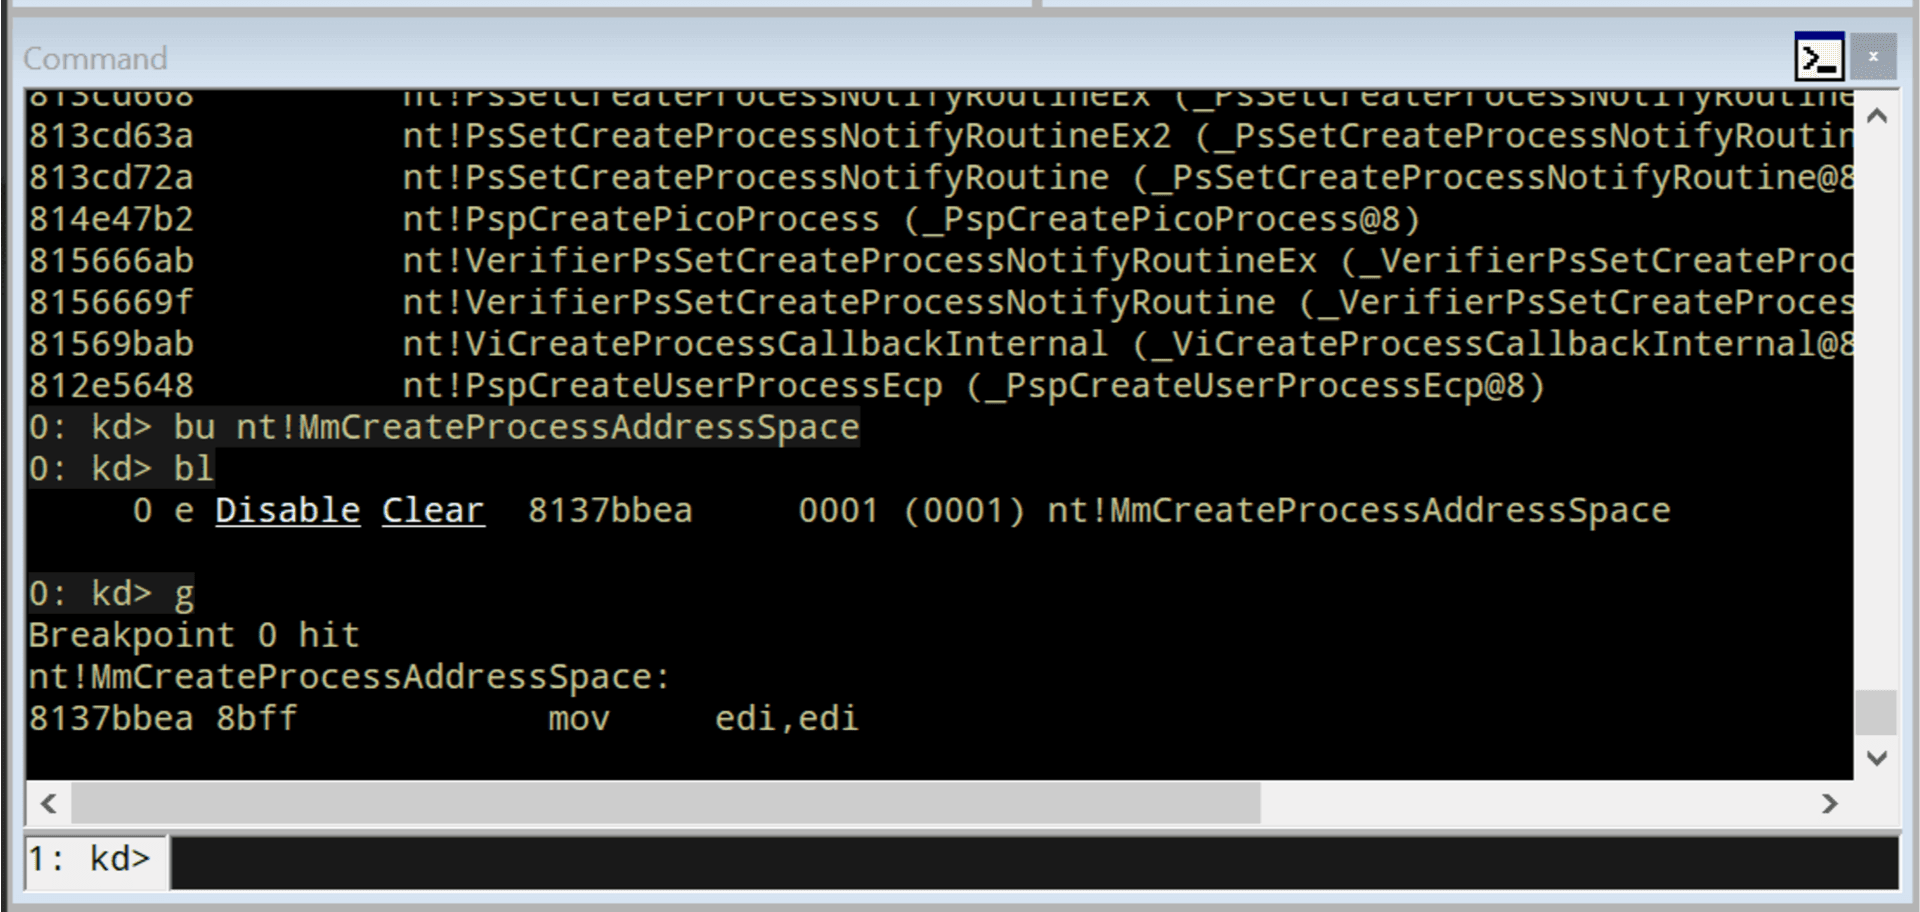
Now, set a breakpoint in nt!MmCreateProcessAddressSpace and resume execution:
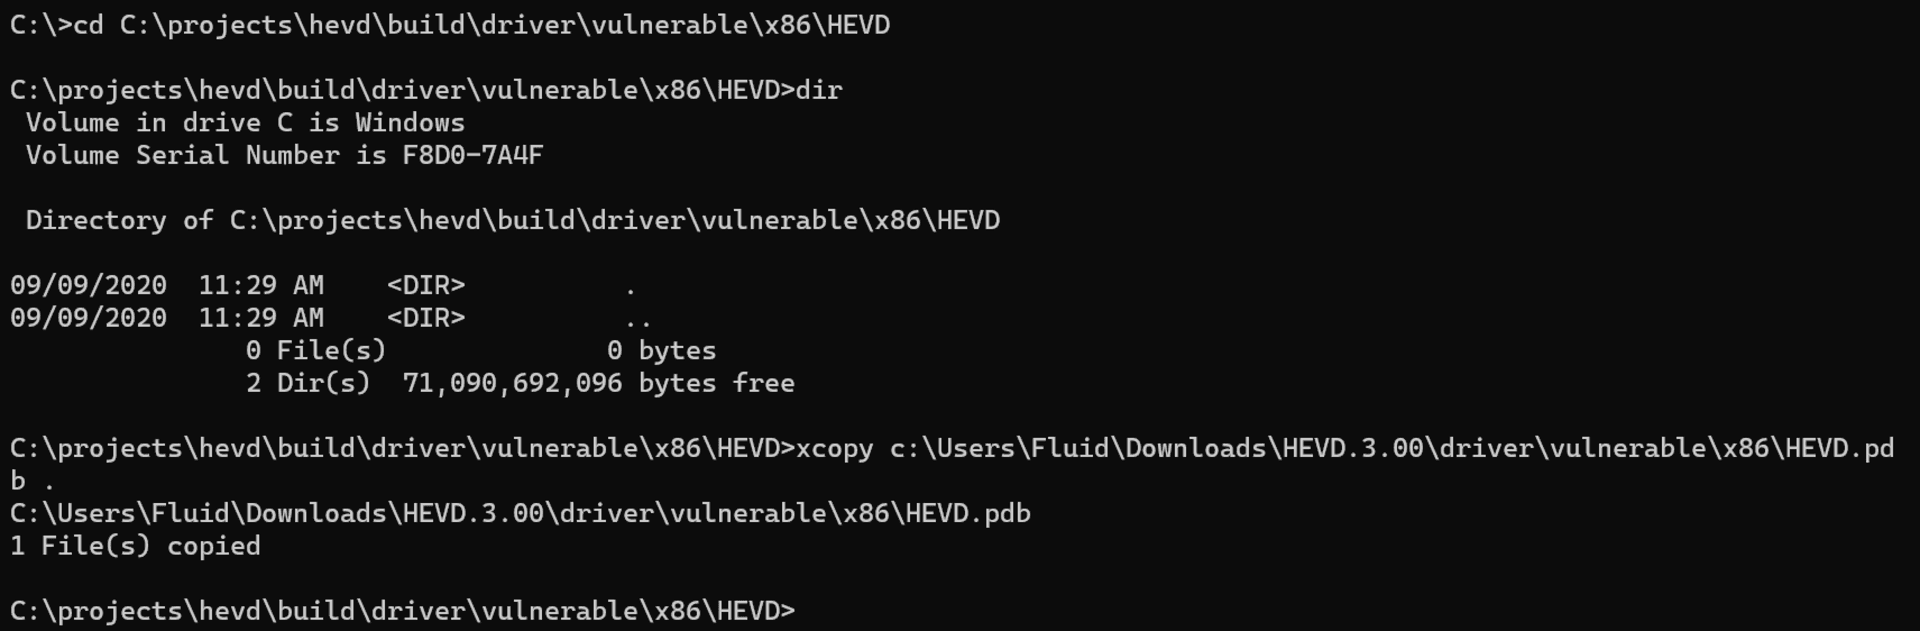
Great! But as we are going to debug HEVD, we must add the debugging symbols to our environment. If you look at the folder HEVD.3.00\driver\vulnerable\x86 you can see several files, including the HEVD.sys driver file and HEVD.pdb. The latter is the file containing the HEVD debugging symbols. To load it on our debugger, follow these steps:
Create a folder called
C:\projects\hevd\build\driver\vulnerable\x86\HEVDCopy the
HEVD.pdbfile in that directory.
On WinDBG, type .reload
Type
lm m HEVDto check if theHEVDmodule is loaded.And type
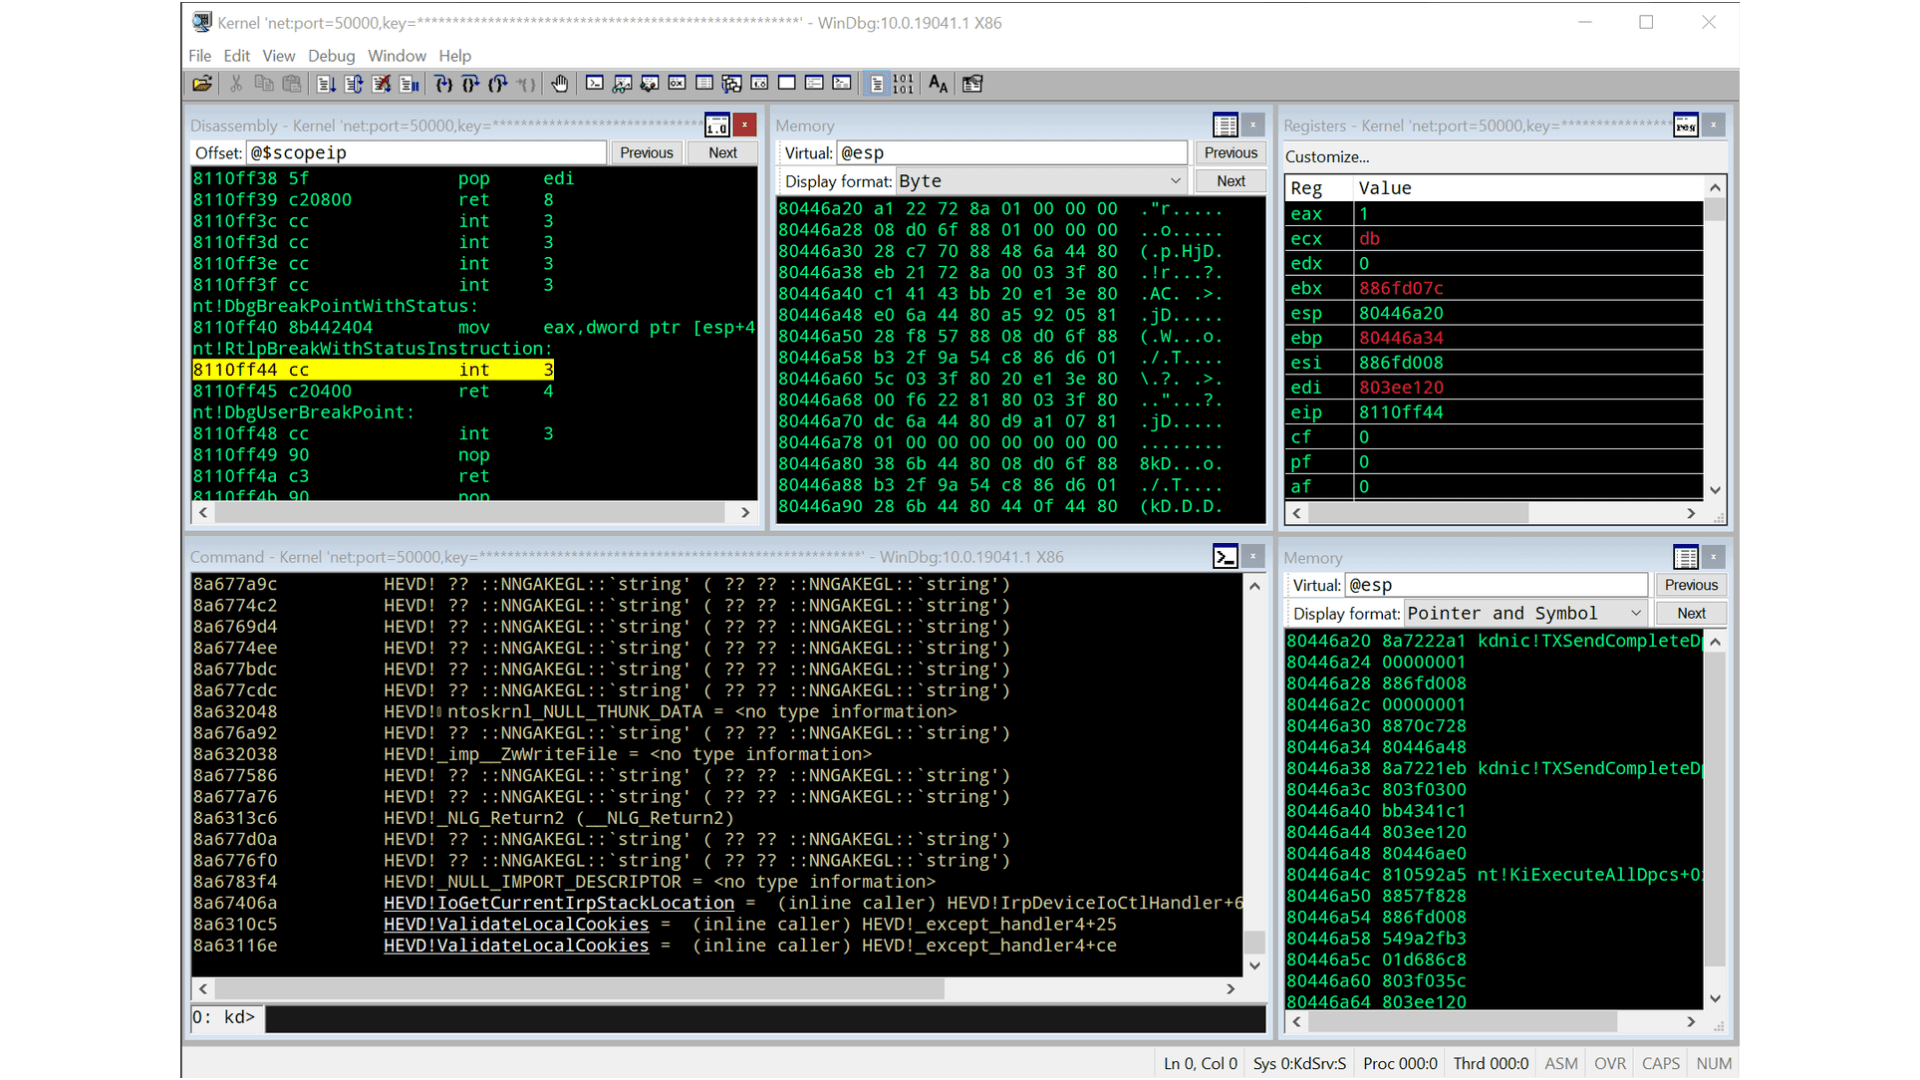
x HEVD!*to check if the symbols were successfully added.

With that, we can start debugging our target machine’s kernel space!:
In the next post, you can see a short reference of WinDBG commands that we will be using during this process.
Conclusions
This post will help you to setup a working Windows Kernel debugging lab. In the next posts we will be dealing with some theory on Windows Kernel and will start exploiting HEVD.

Get started with Fluid Attacks' PTaaS right now
Suscríbete a nuestro boletín
Mantente al día sobre nuestros próximos eventos y los últimos blog posts, advisories y otros recursos interesantes.
Otros posts