Attacks
HEVD denial of service: How to crash Windows

VP of Hacking
Updated
Sep 14, 2020
5 min
In the last post, we were able to set up a lab environment to start exploiting vulnerabilities in the Windows kernel space.
This article will focus on the first steps to exploit the vulnerabilities on HackSys Extreme Vulnerable Driver (HEVD).
First, we need to get familiar with WinDBG, a very powerful debugger from Microsoft with a steep learning curve. We’ll also use IDA, specifically the freeware version, which is enough for most of what we’re going to face.
In the end, we’re going to be able to crash our Windows 10 OS by leveraging a vulnerability on HEVD. It's nice to crash things for the sake of science.
Let’s get our hands dirty!
WinDBG 101
Before dealing with the exploitation process, I will list some WinDBG commands that have helped me. This is selfishly written as a reference for myself but kindly shared with you.
g: Short forGo. It will resume the execution of the debugged.

t: Short forStep Into. It will execute the next instruction. If it’s acall, it will jump into the call content.p: Sort forStep Over. It will execute the next instruction. If it’s acall, it will execute whatever the call does and jump over it.gu: Short forStep Out. Will resume the execution until aretinstruction is found. Useful when youStep Intoa function and want to return to the place it was called.
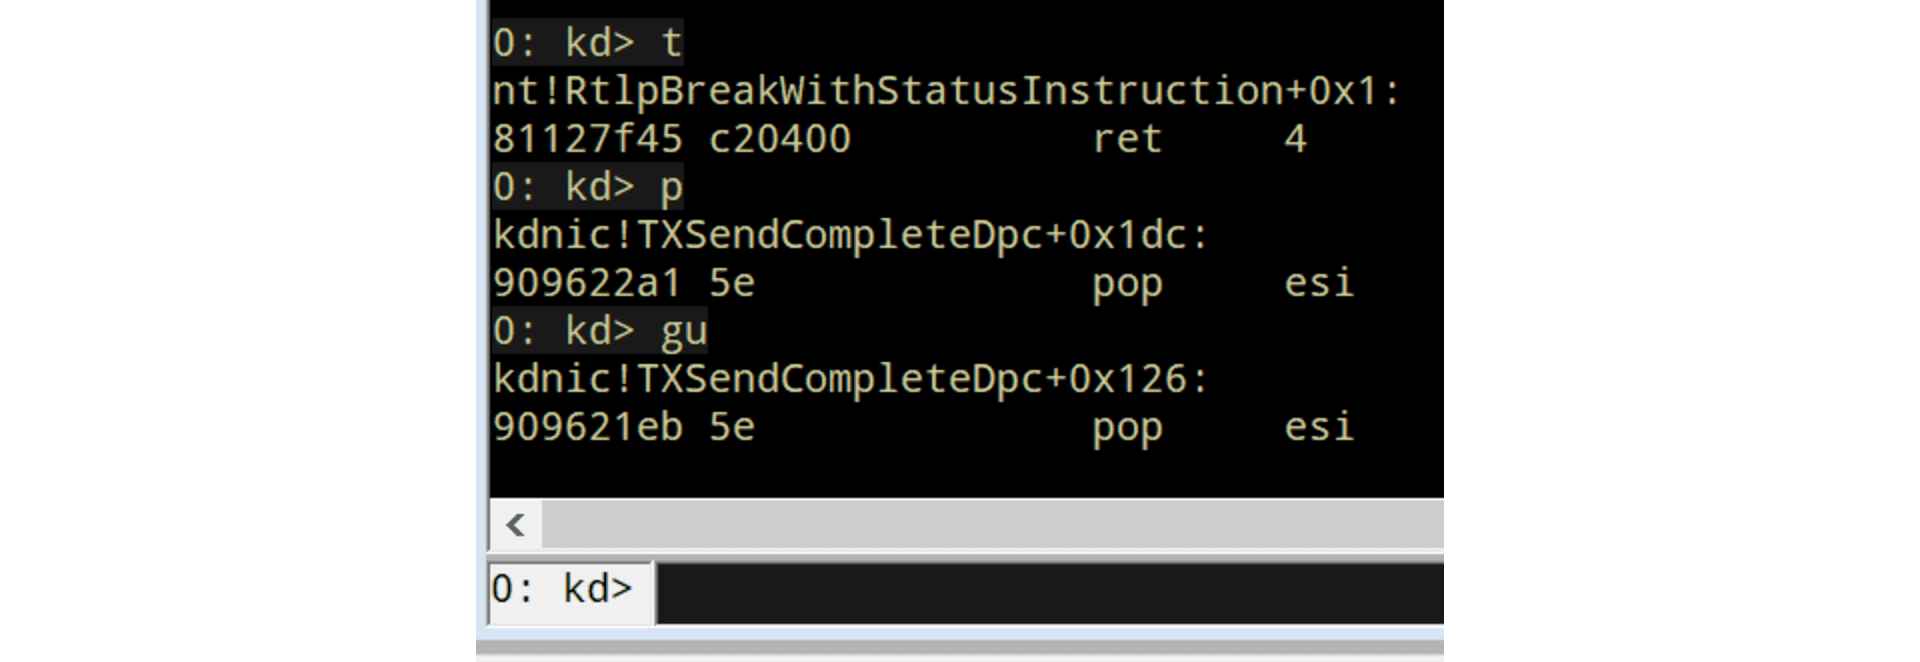
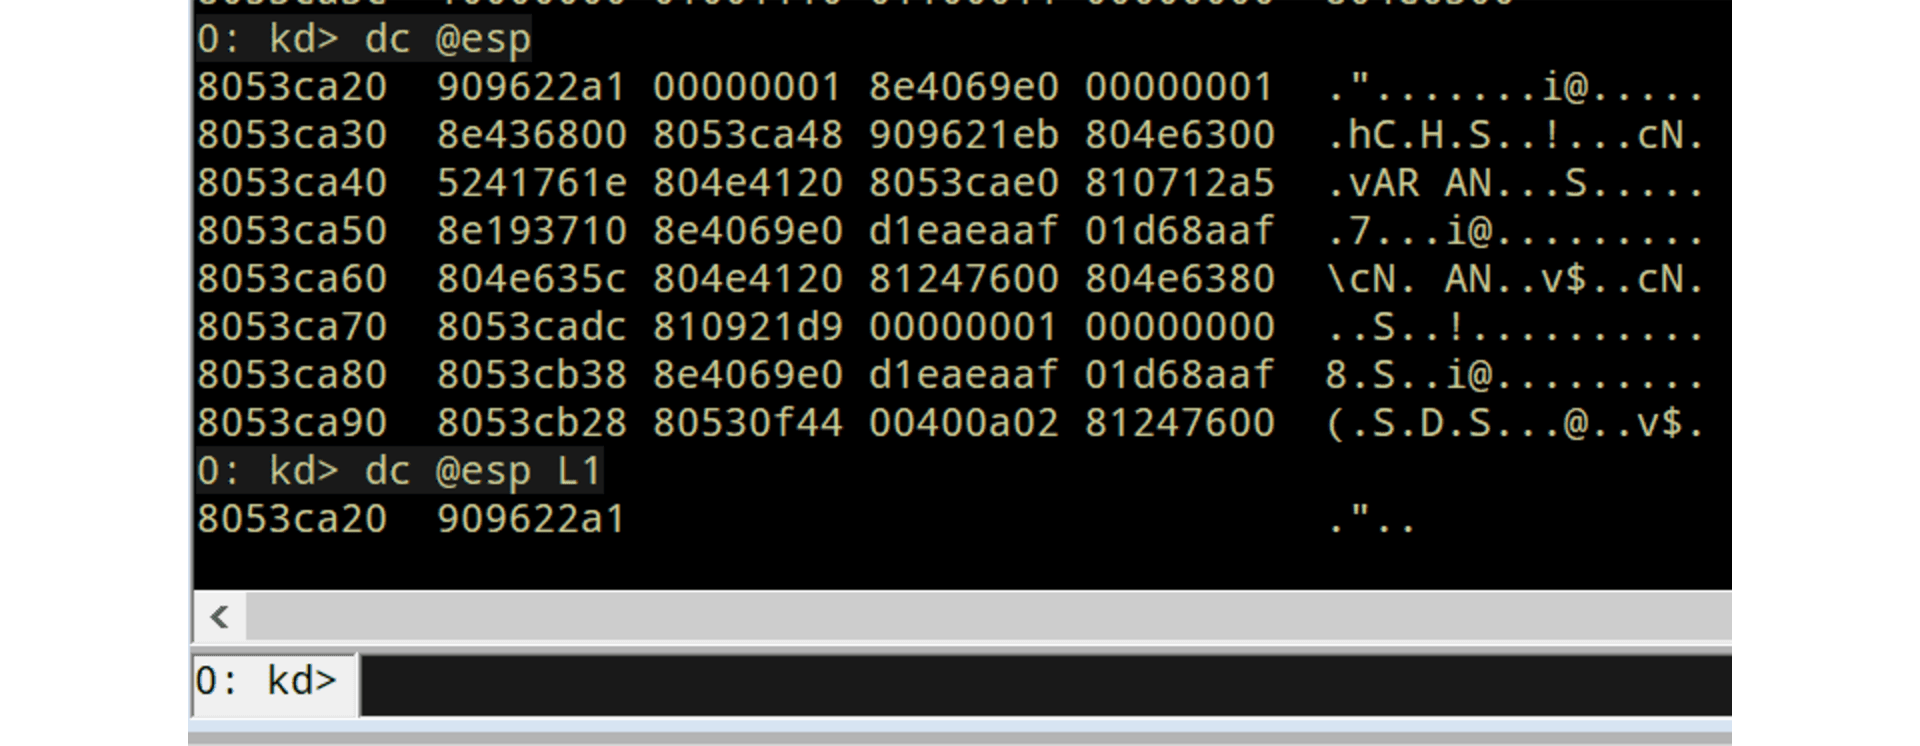
d*family: Short forDisplay Memory. It will dump the contents of a given memory address. The most useful variation on 32 bits debugging isdc(dump double-word and ASCII chars).
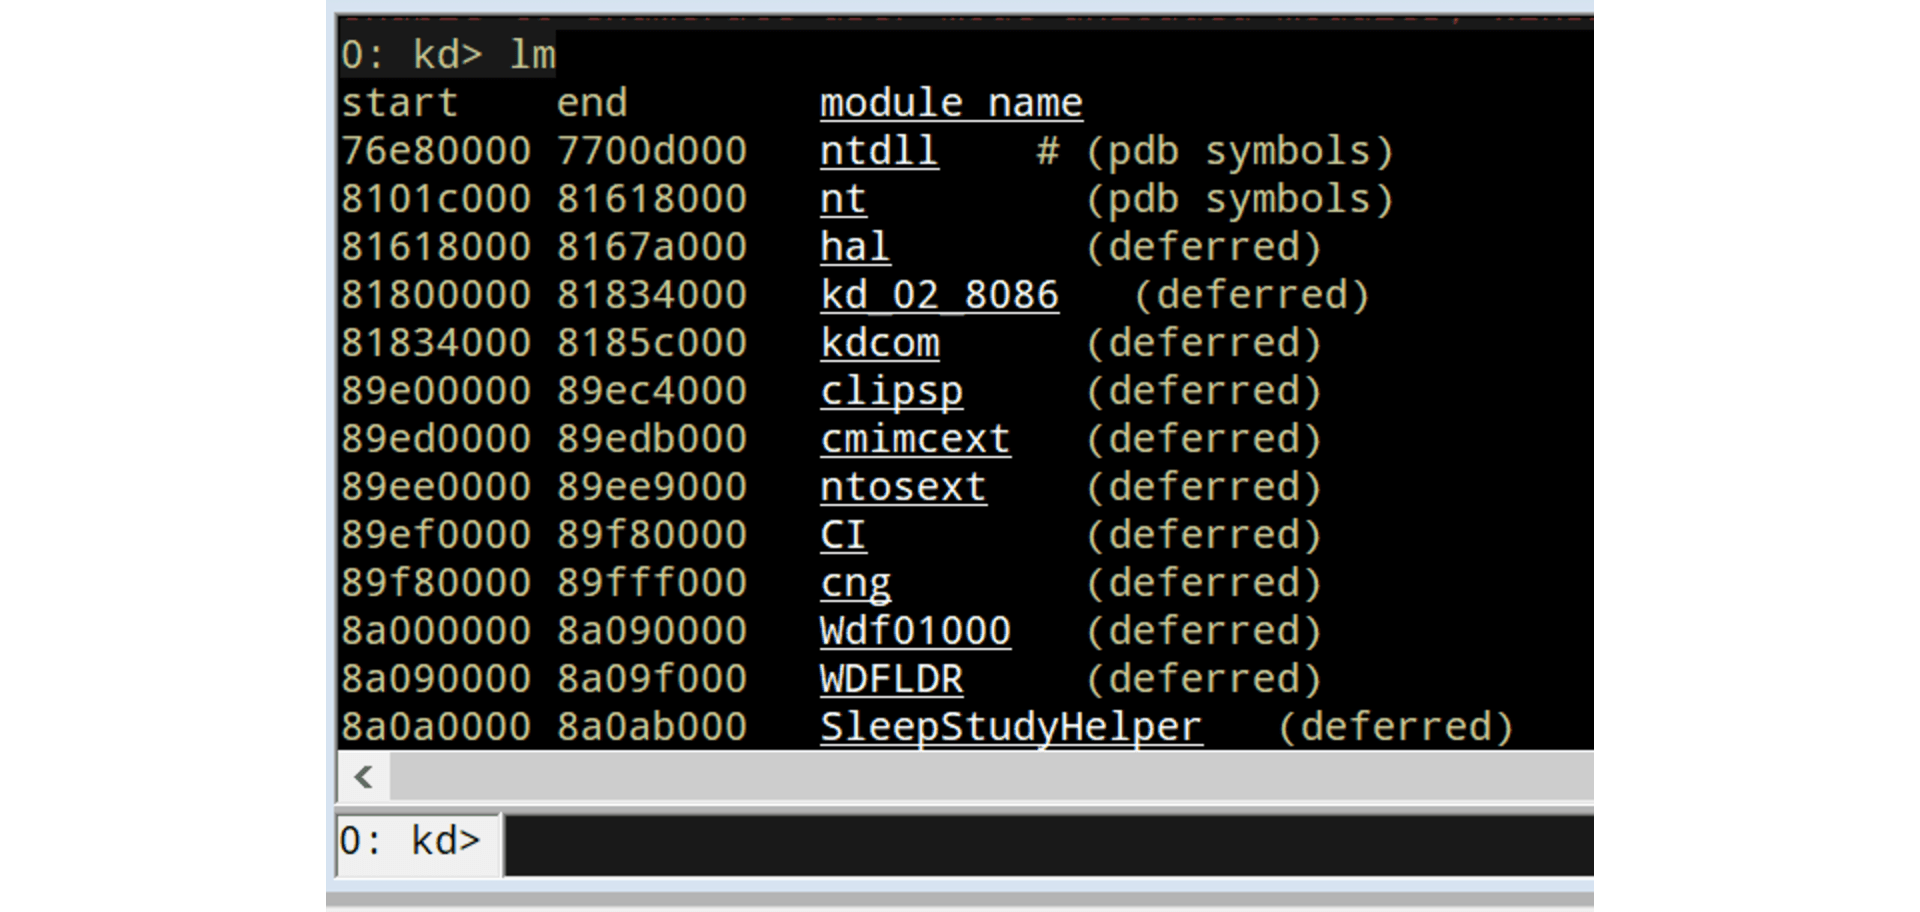
lm: Short forList Loaded Modules. You can filter the output usinglm m <module>.

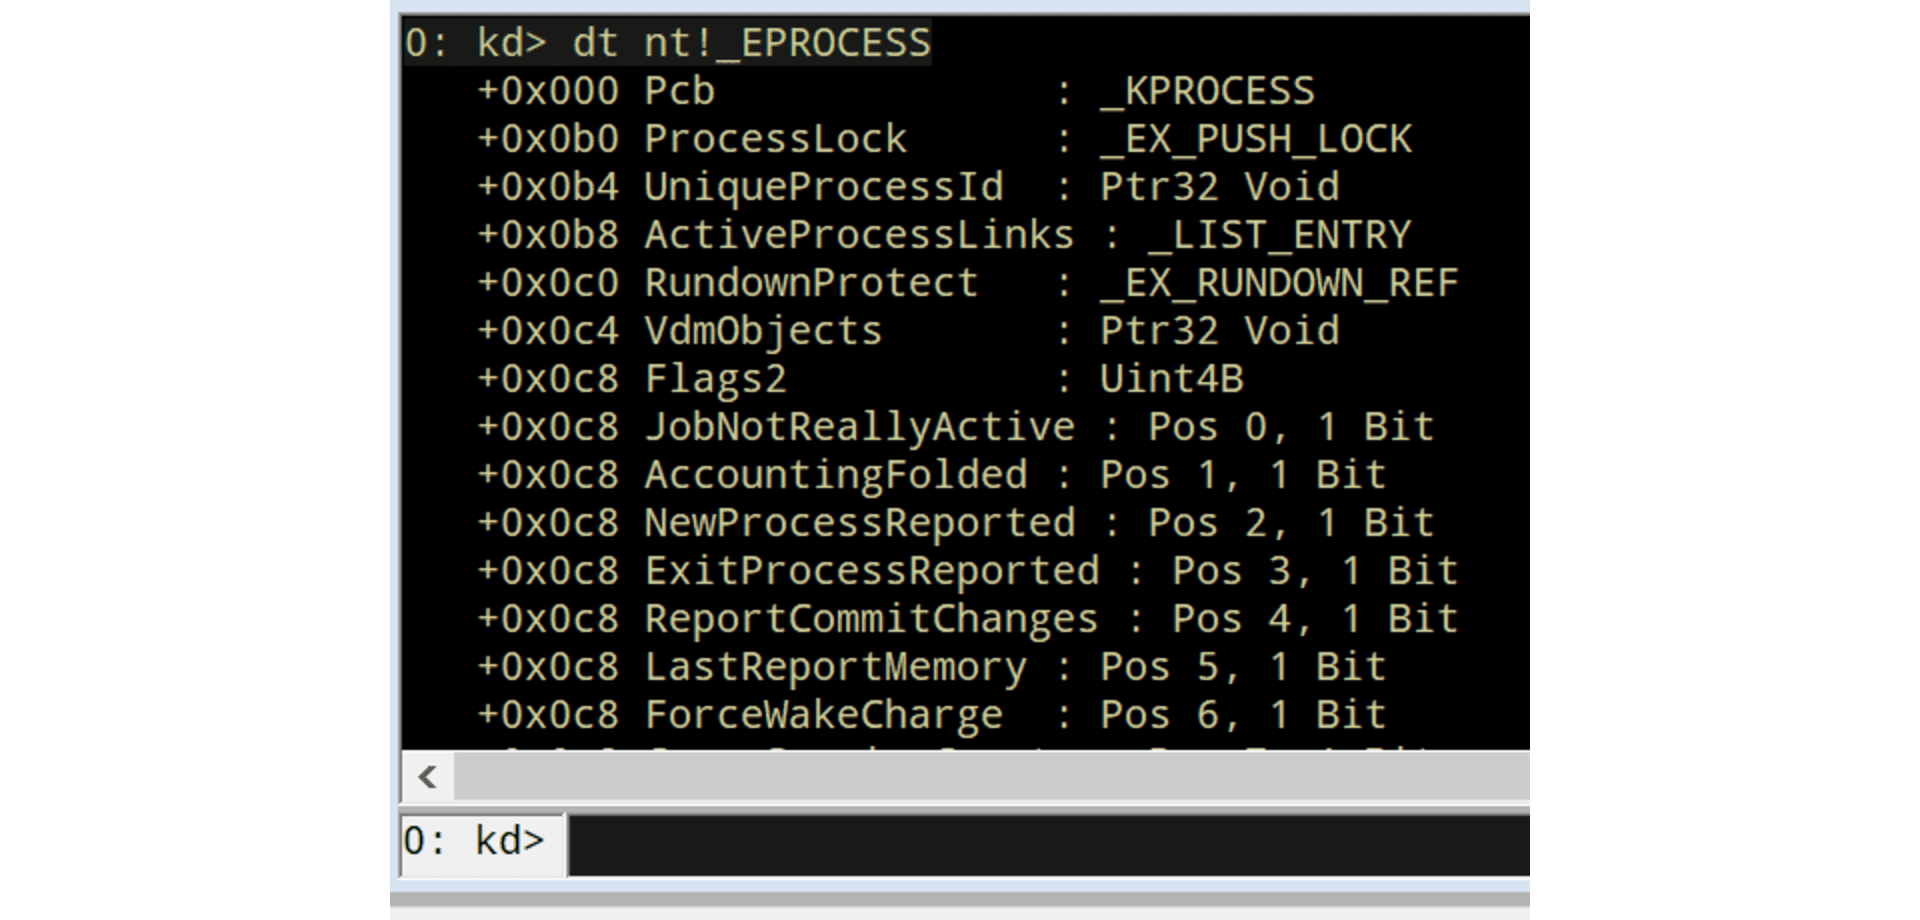
dt: Short forDisplay Type. It is used to list data structures.
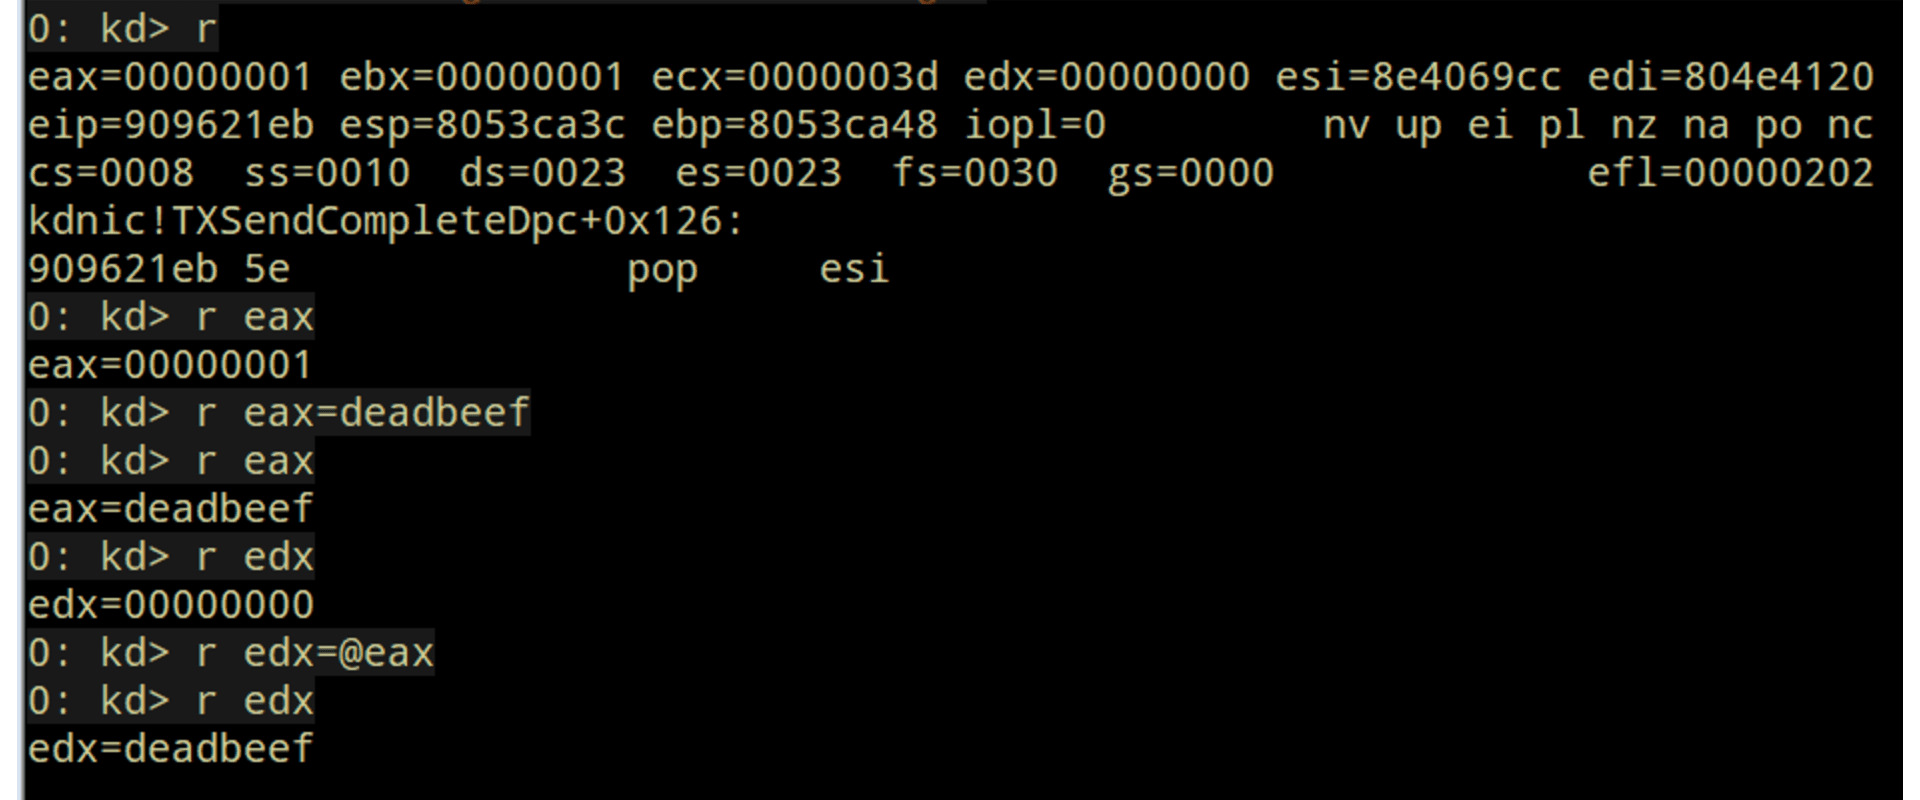
r: Short forRegisters. It will show the value of all the processor registers and flags. It’s also used to change the value of a register.
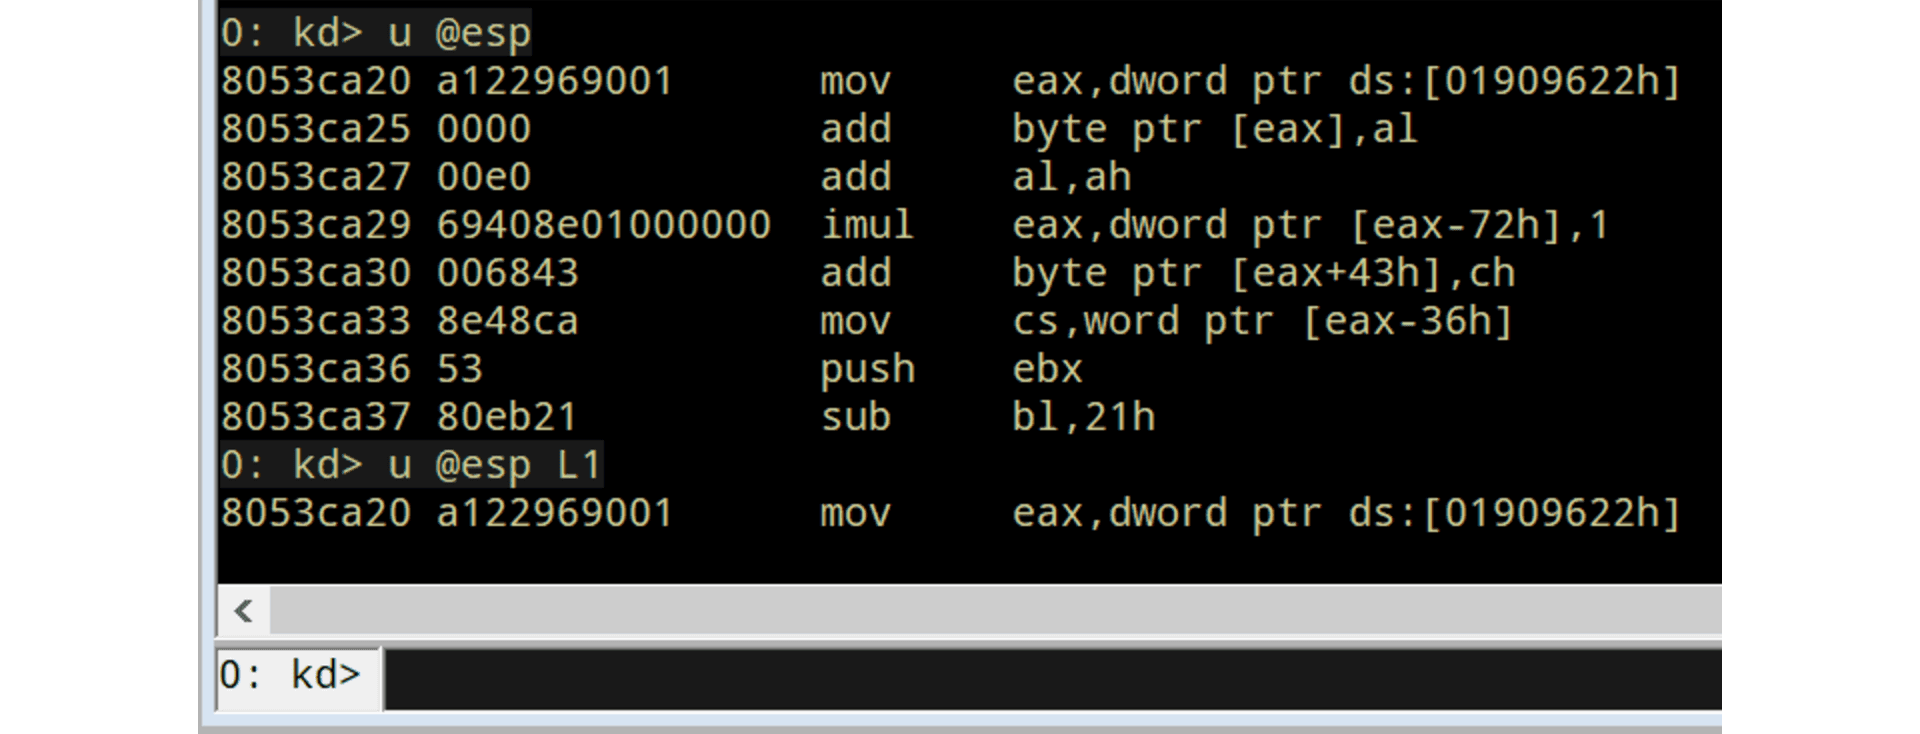
u: Short forUnassemble. It will show the instructions at the given memory address.
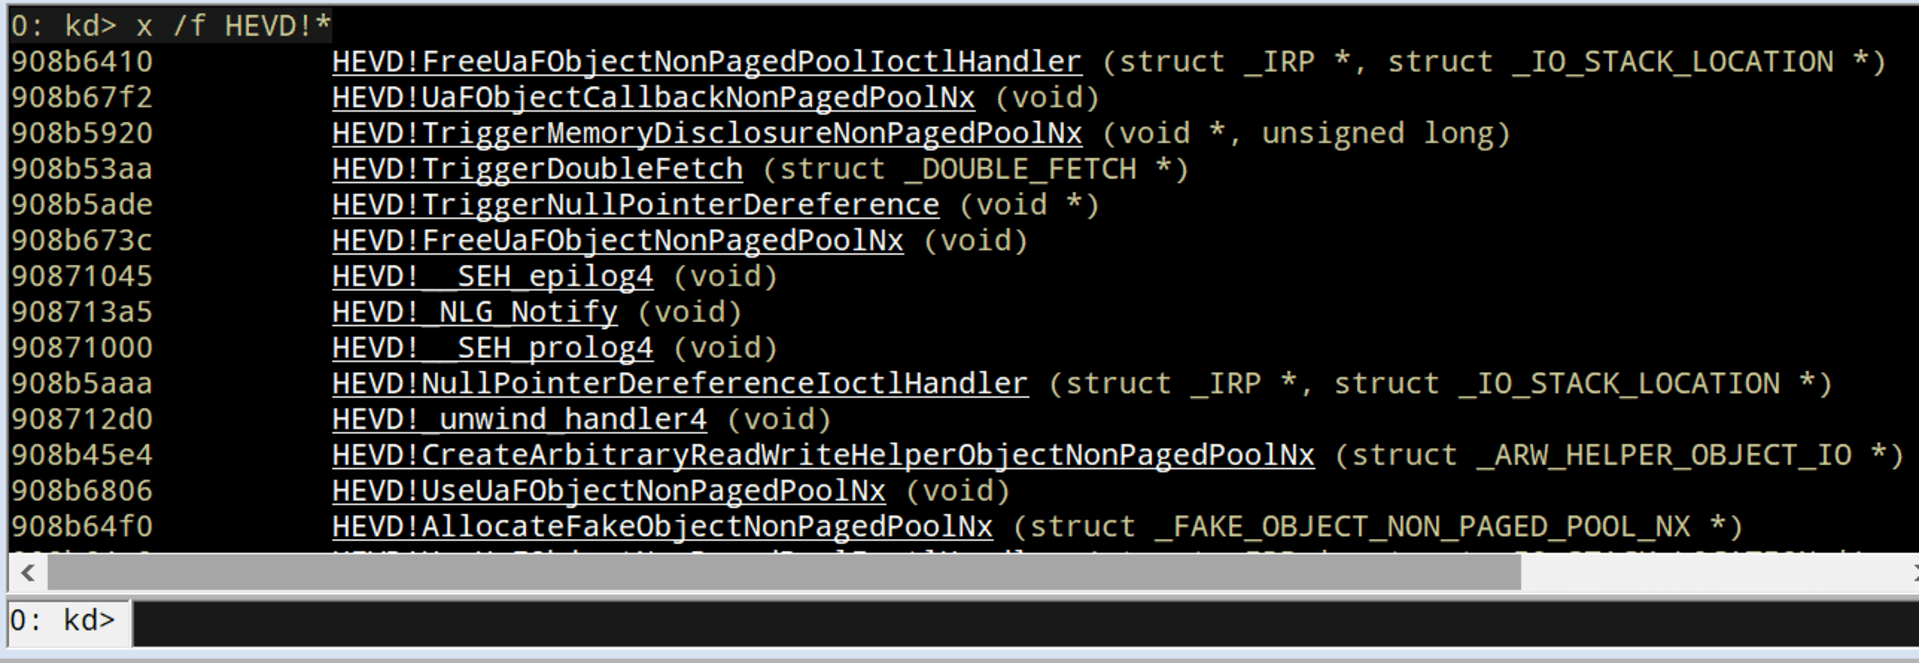
x: Short forExamine Symbols. It will show the symbols at a given module.
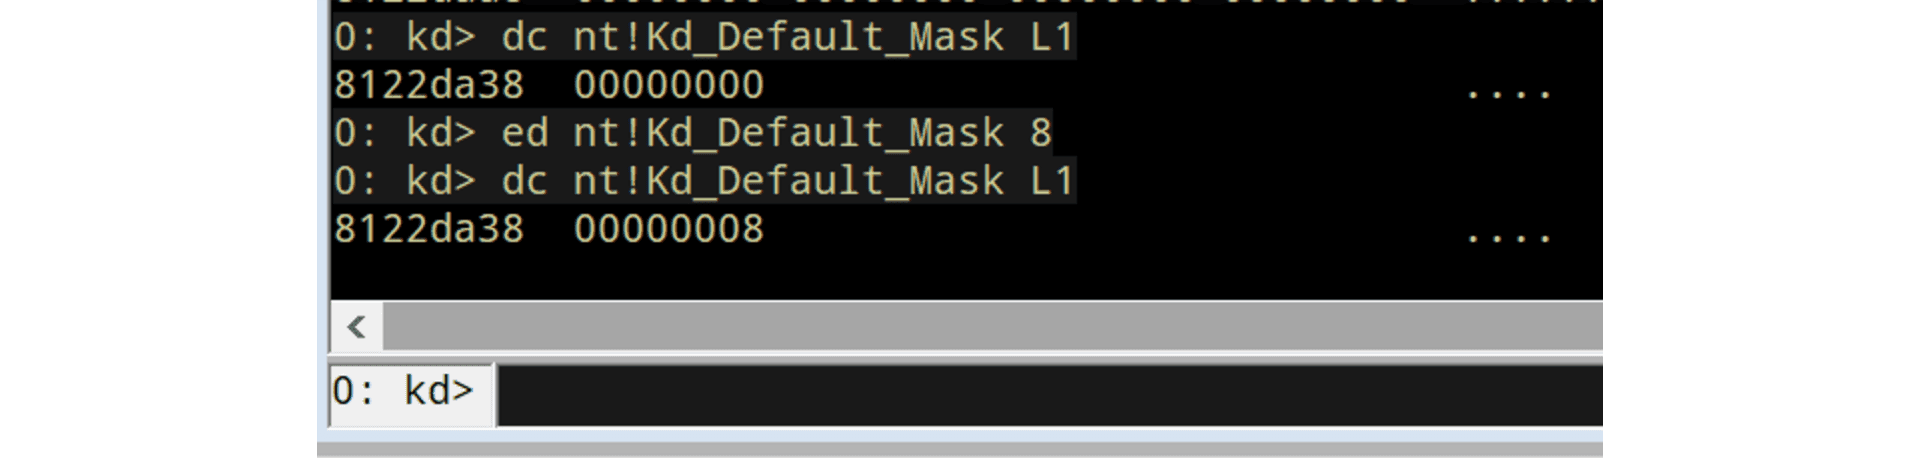
e*family: Short forEnter Values. It will enter a given value to a specified memory location. The most used variation on 32 bits debugging ised(enter double-word value).
?: Evaluate expression.

bp: Short forBreakpoint. It will set a software breakpoint at a given address.bl: Short forList Breakpoints. It will list current breakpoints.bc: Short forClear Breakpoint. It will remove breakpoints.
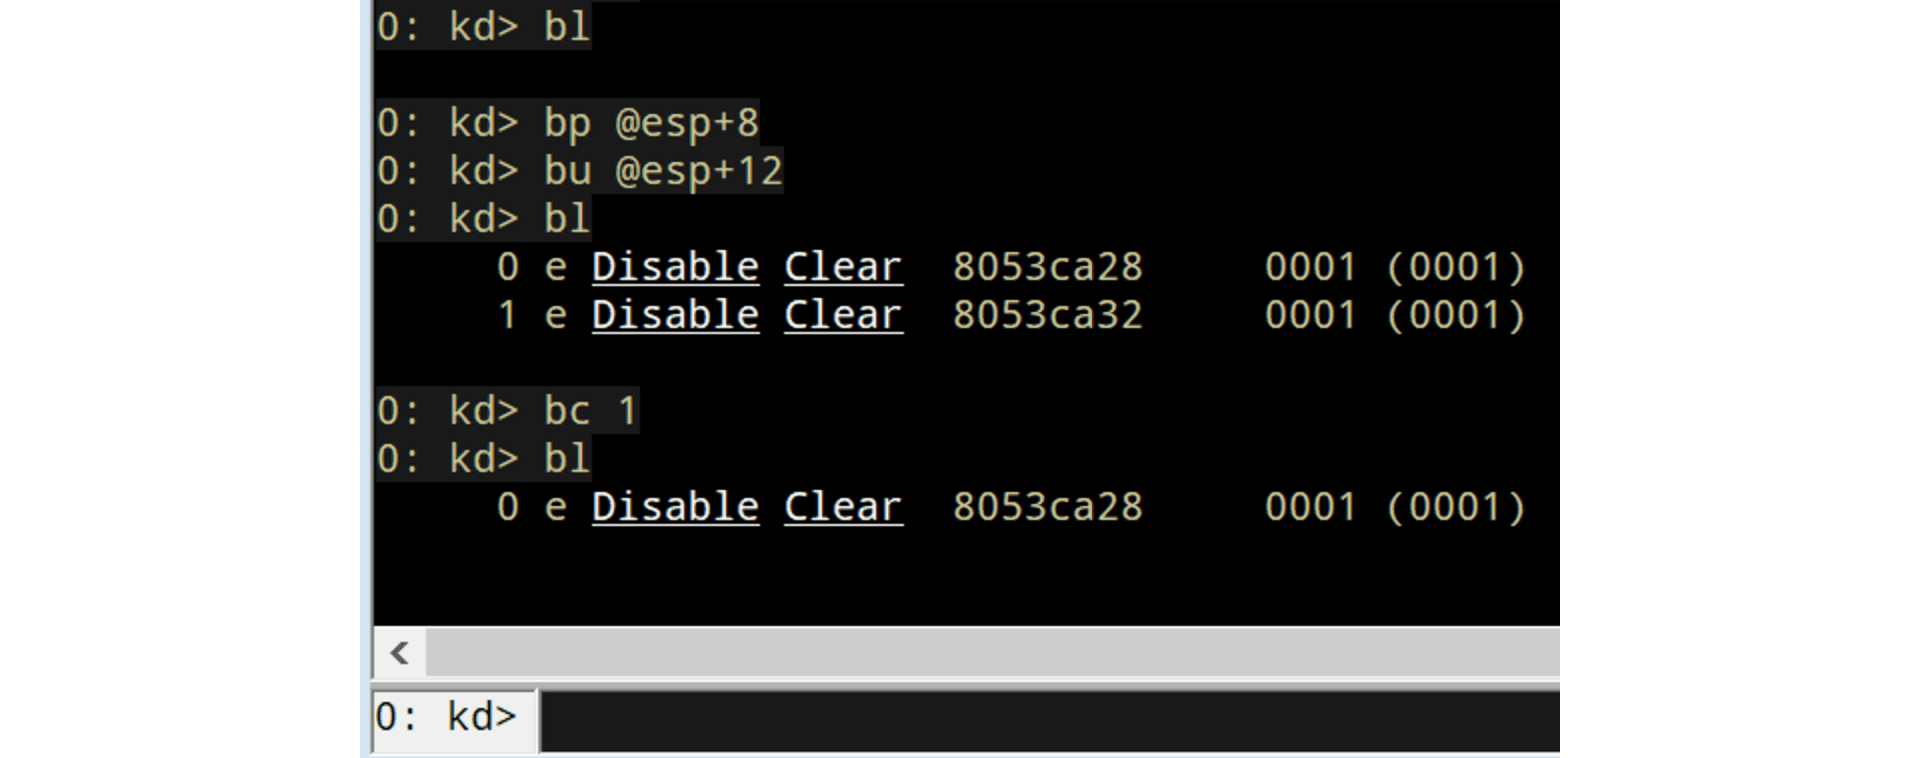
This is by no means a comprehensive WinDBG reference but will show the commands I use the most when debugging.
Talking to Windows drivers
The common main goal of Windows Kernel exploitation is to elevate privileges to perform any desired task on the affected computer with the most powerful permissions. We do that by finding a vulnerability in a piece of code running at kernel-space and establishing a communication between the exploit in user-mode and the target in kernel-mode, which is where the drivers live.
As Windows runs in protected mode, user-land instructions cannot access to kernel-space memory. However, there is an interface provided by the OS that allows talking to drivers: IOCTL calls.
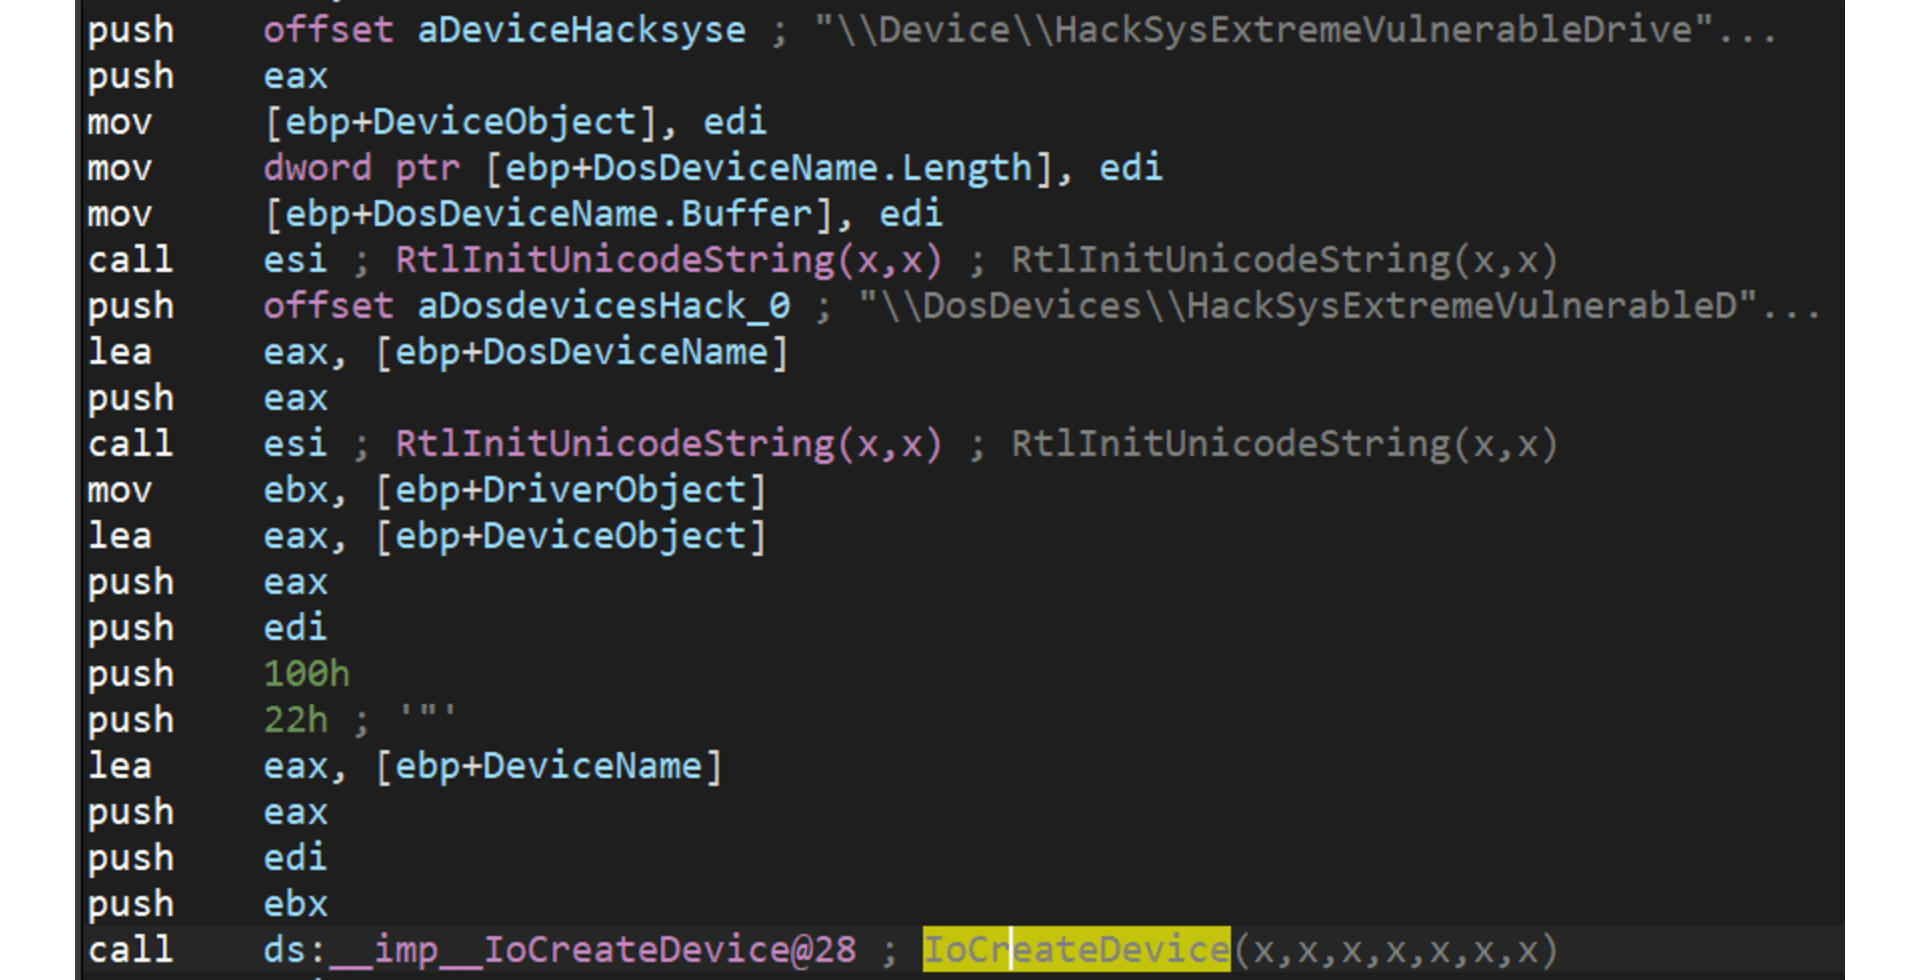
When a driver is installed, it sets a device name using the IoCreateDevice call.
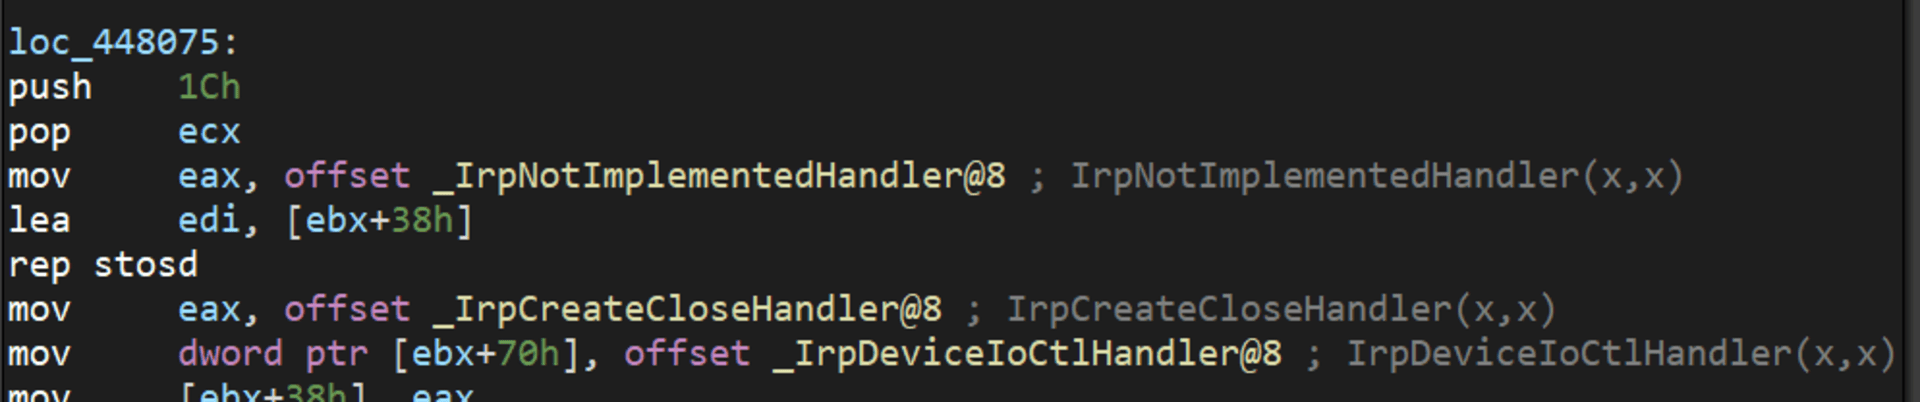
It then defines the routines that will expose. Commonly, those routines are basically functions that will interact with other layers of the OS (Hardware Abstraction Layer or HAL, for example) to manipulate a hardware device. In HEVD, those routines are functions happening at kernel-level with several vulnerabilities.
Each routine is identified by an IOCTL (I/O control) code.
The driver will accept calls to that routines using IRP (I/O Request Packets) structures and will set a handler that will dispatch the specific routine, given a specific IOCTL code:
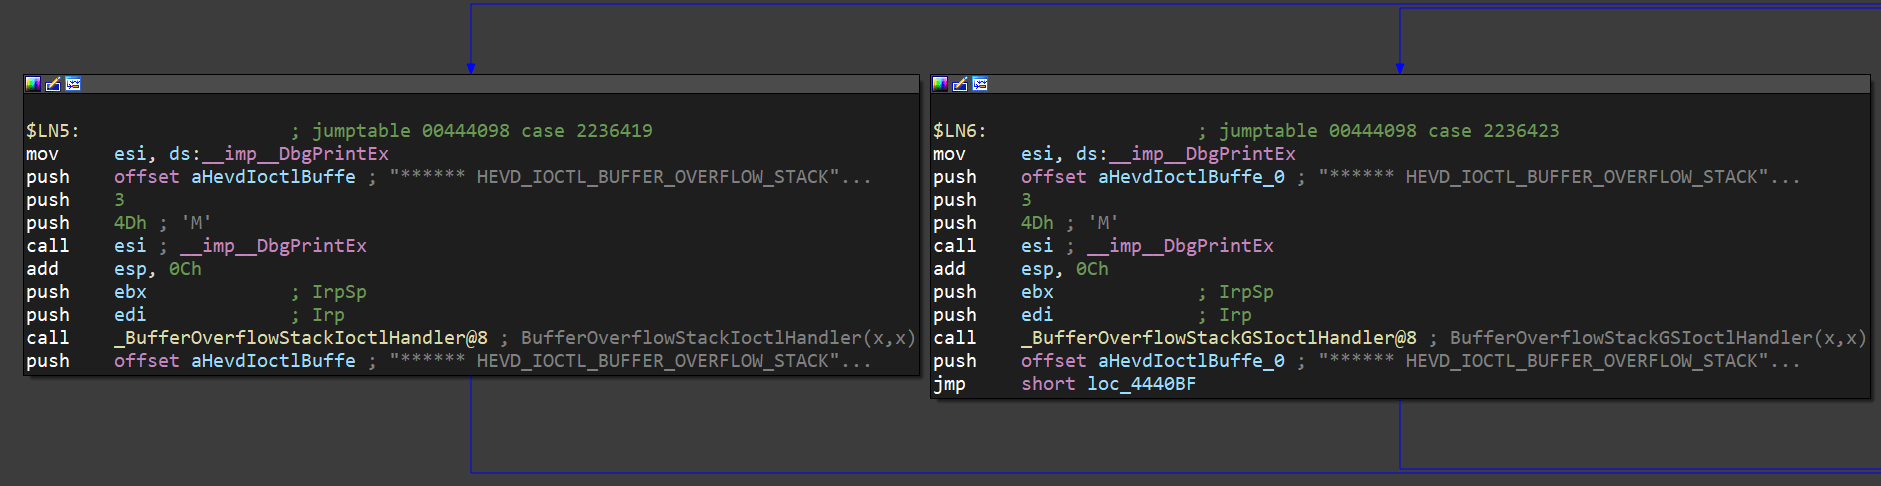
The IrpDeviceIoCtlHandler function in HEVD creates a jump table (like a switch statement) for each managed IOCTL code:
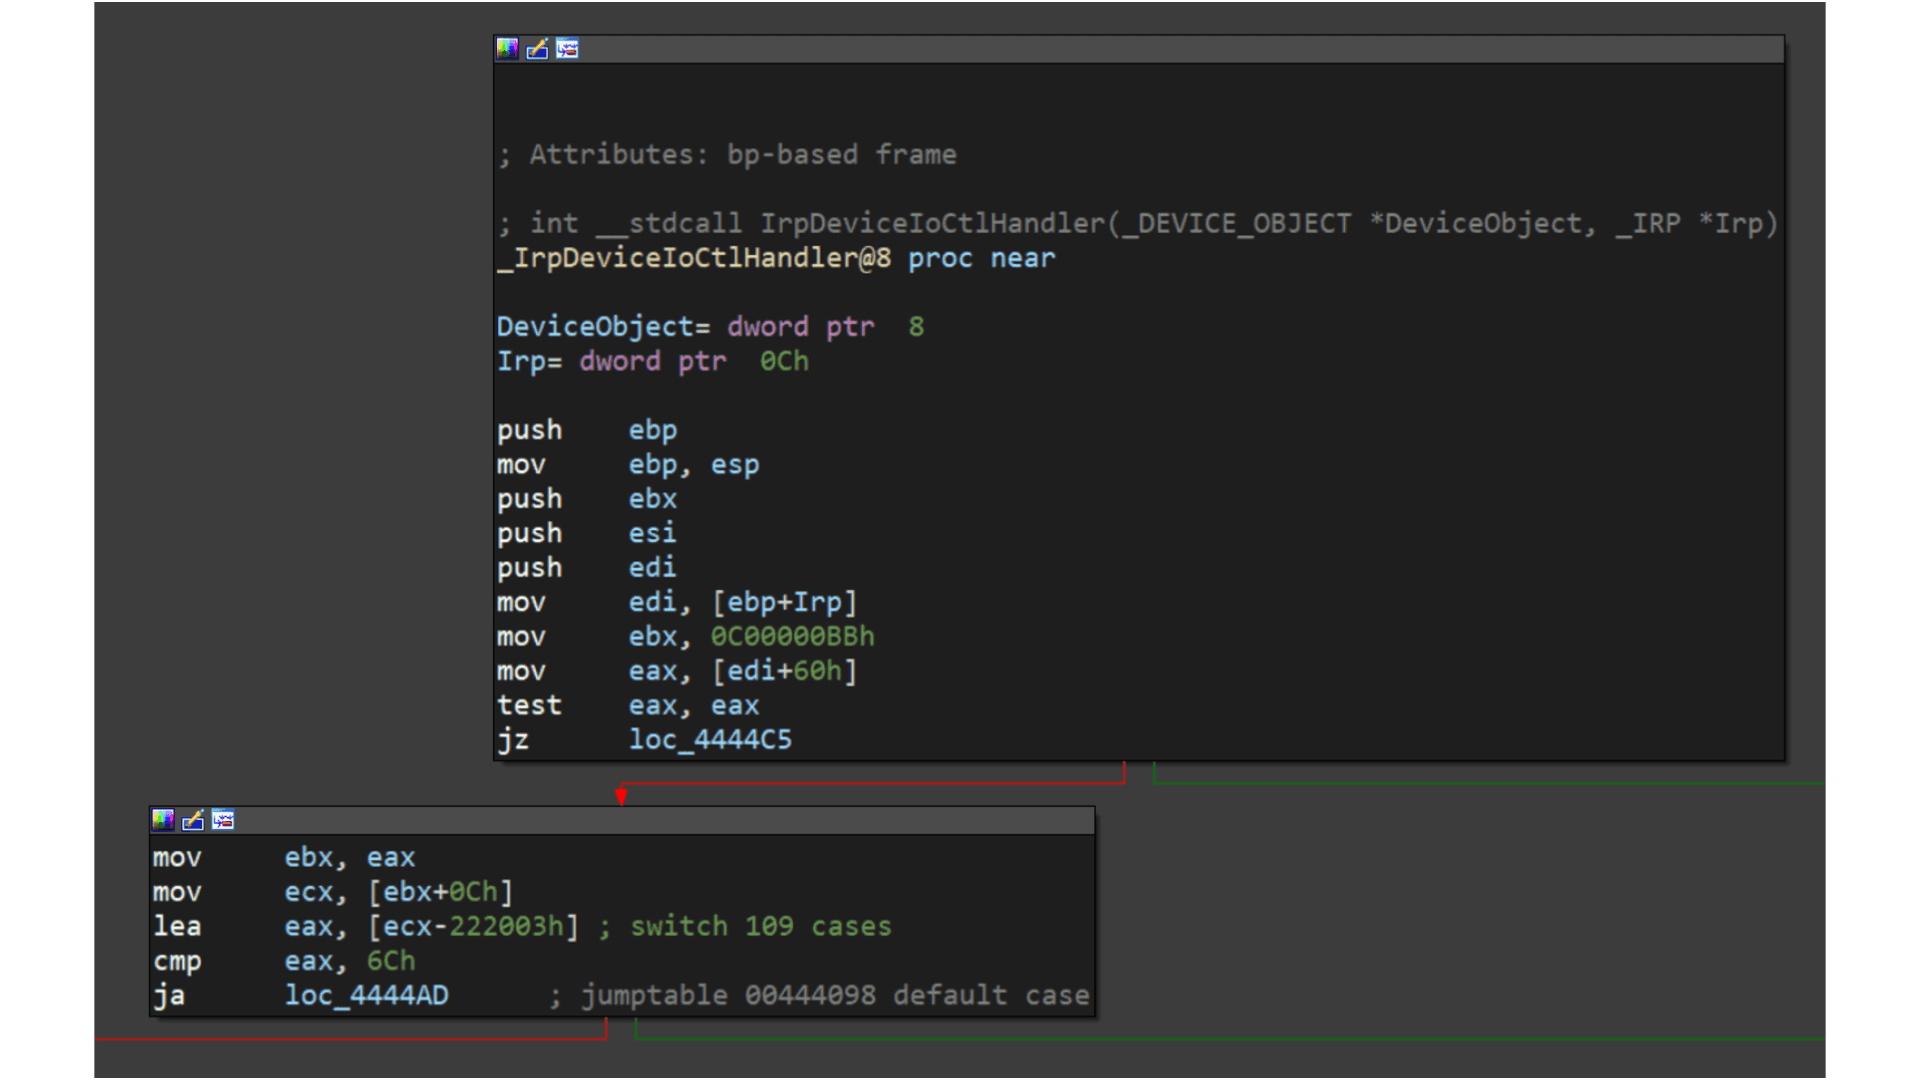
In HEVD, each case of that switch statement is handled by another function that will trigger a specific vulnerable function:
Now, if we want to talk to that driver, we must get a handle on the driver’s device name, which is HackSysExtremeVulnerableDrive in the case of HEVD, and use the DeviceIoControl function to send the IOCTL code we want, along with the payload.
In Python, there’s a third-party package called infi.wioctl that wraps those calls nicely:
With that, we can start looking for our first vulnerability on HEVD.
HEVD stack overflow
HEVD has several vulnerabilities built-in. In this post, we will discover the most basic, a stack overflow.
When we look at the jump table generated by the IrpDeviceIoCtlHandler function, the first case is this:
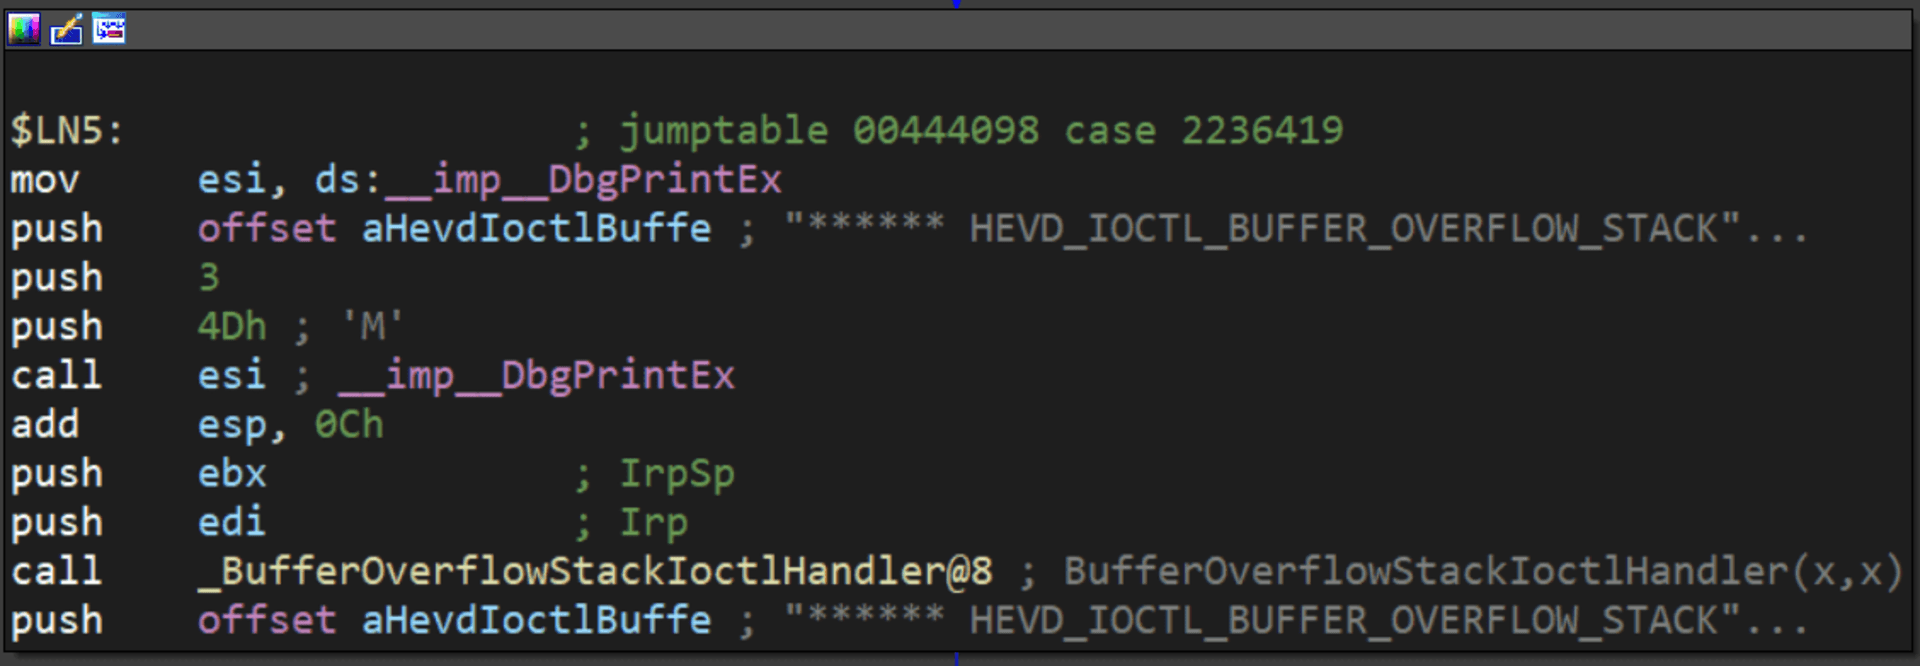
It is triggered when the IOCTL code is 2236419 decimal or 0x222003 in hex. Here, a call to BufferOverflowStackIoctlHandler is performed.
Inside BufferOverflowStackIoctlHandler, there is a check verifying if the IRP package contains user-supplied data. If it does, a call to TriggerBufferOverflowStack is performed:
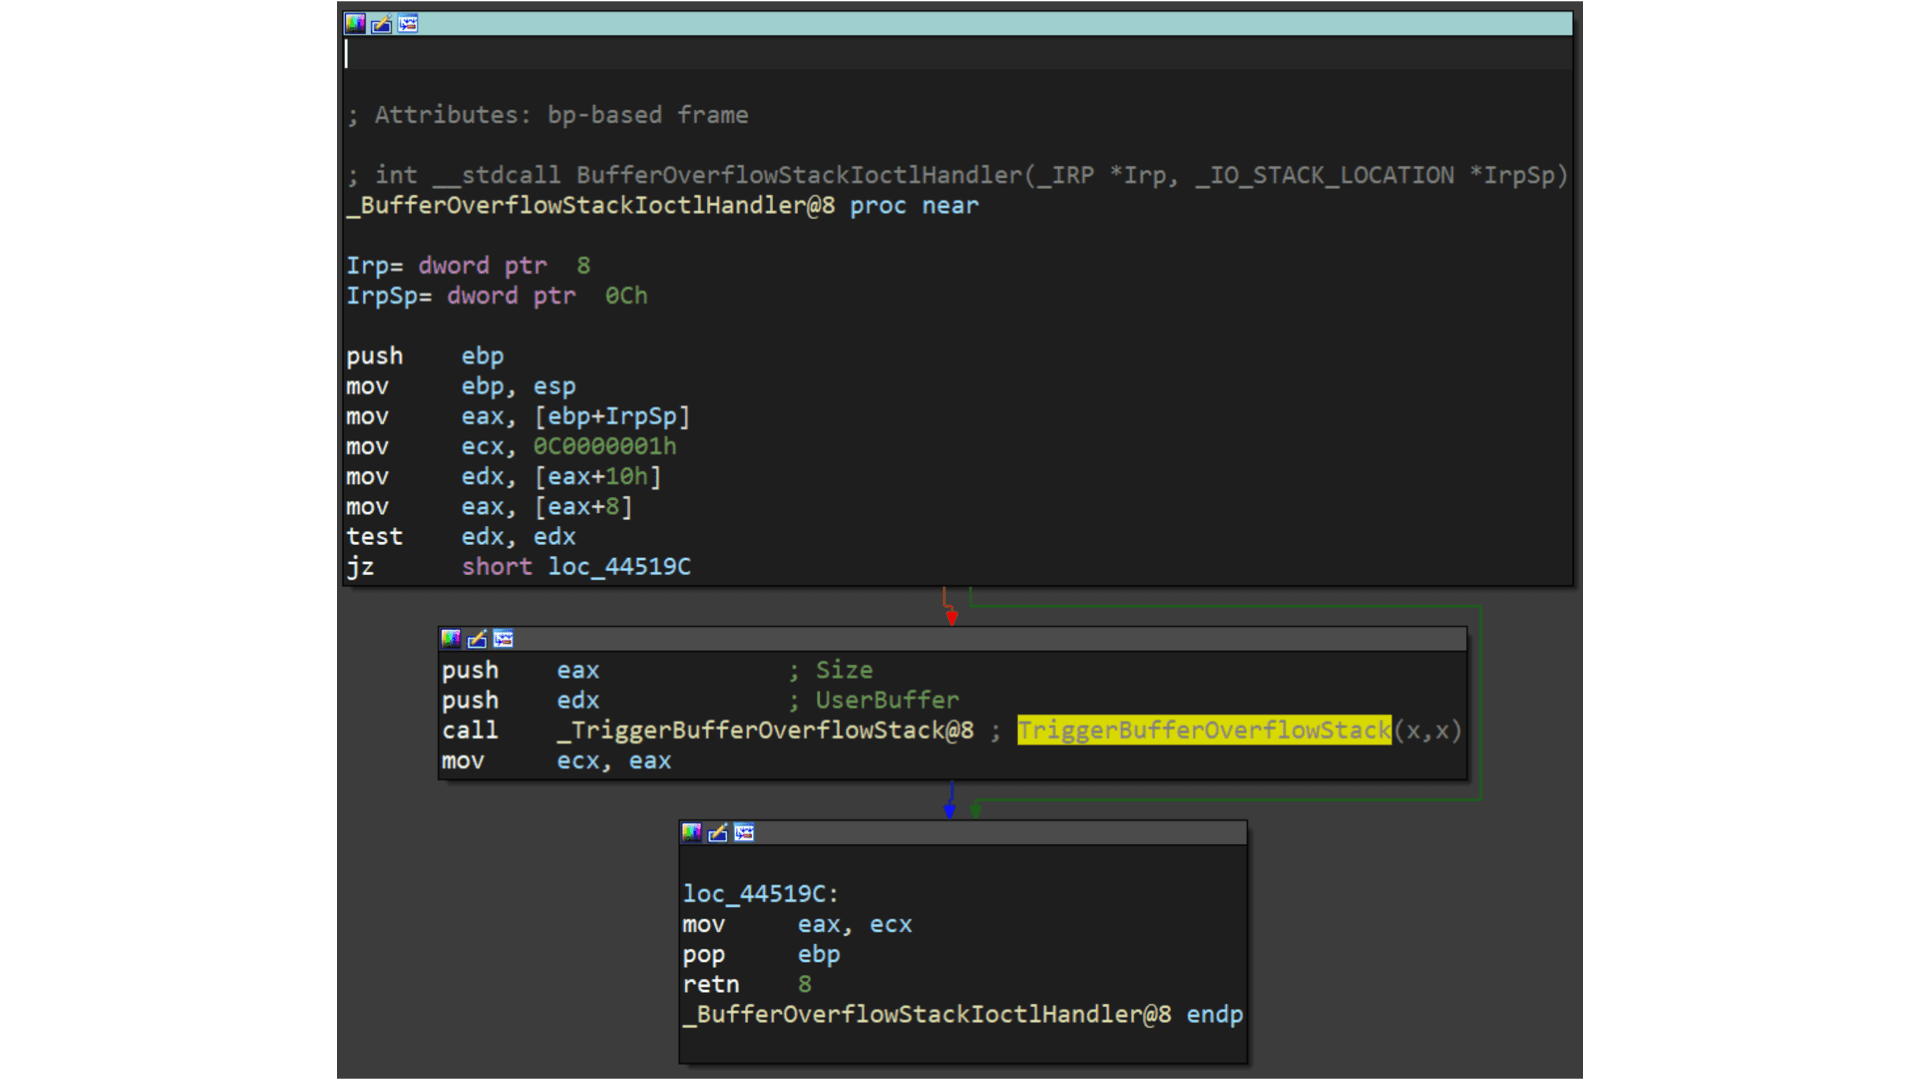
You can also note that the pointer to the user data is placed on EDX and the pointer to the size of the user data is placed on EAX. That information is then pushed to the stack as the parameters for TriggerBufferOverflowStack. You can see the same in the source code of HEVD:
In the TriggerBufferOverflowStack function, the first important thing to notice is that a memset(&KernelBuffer, 0, 800h) call is done:
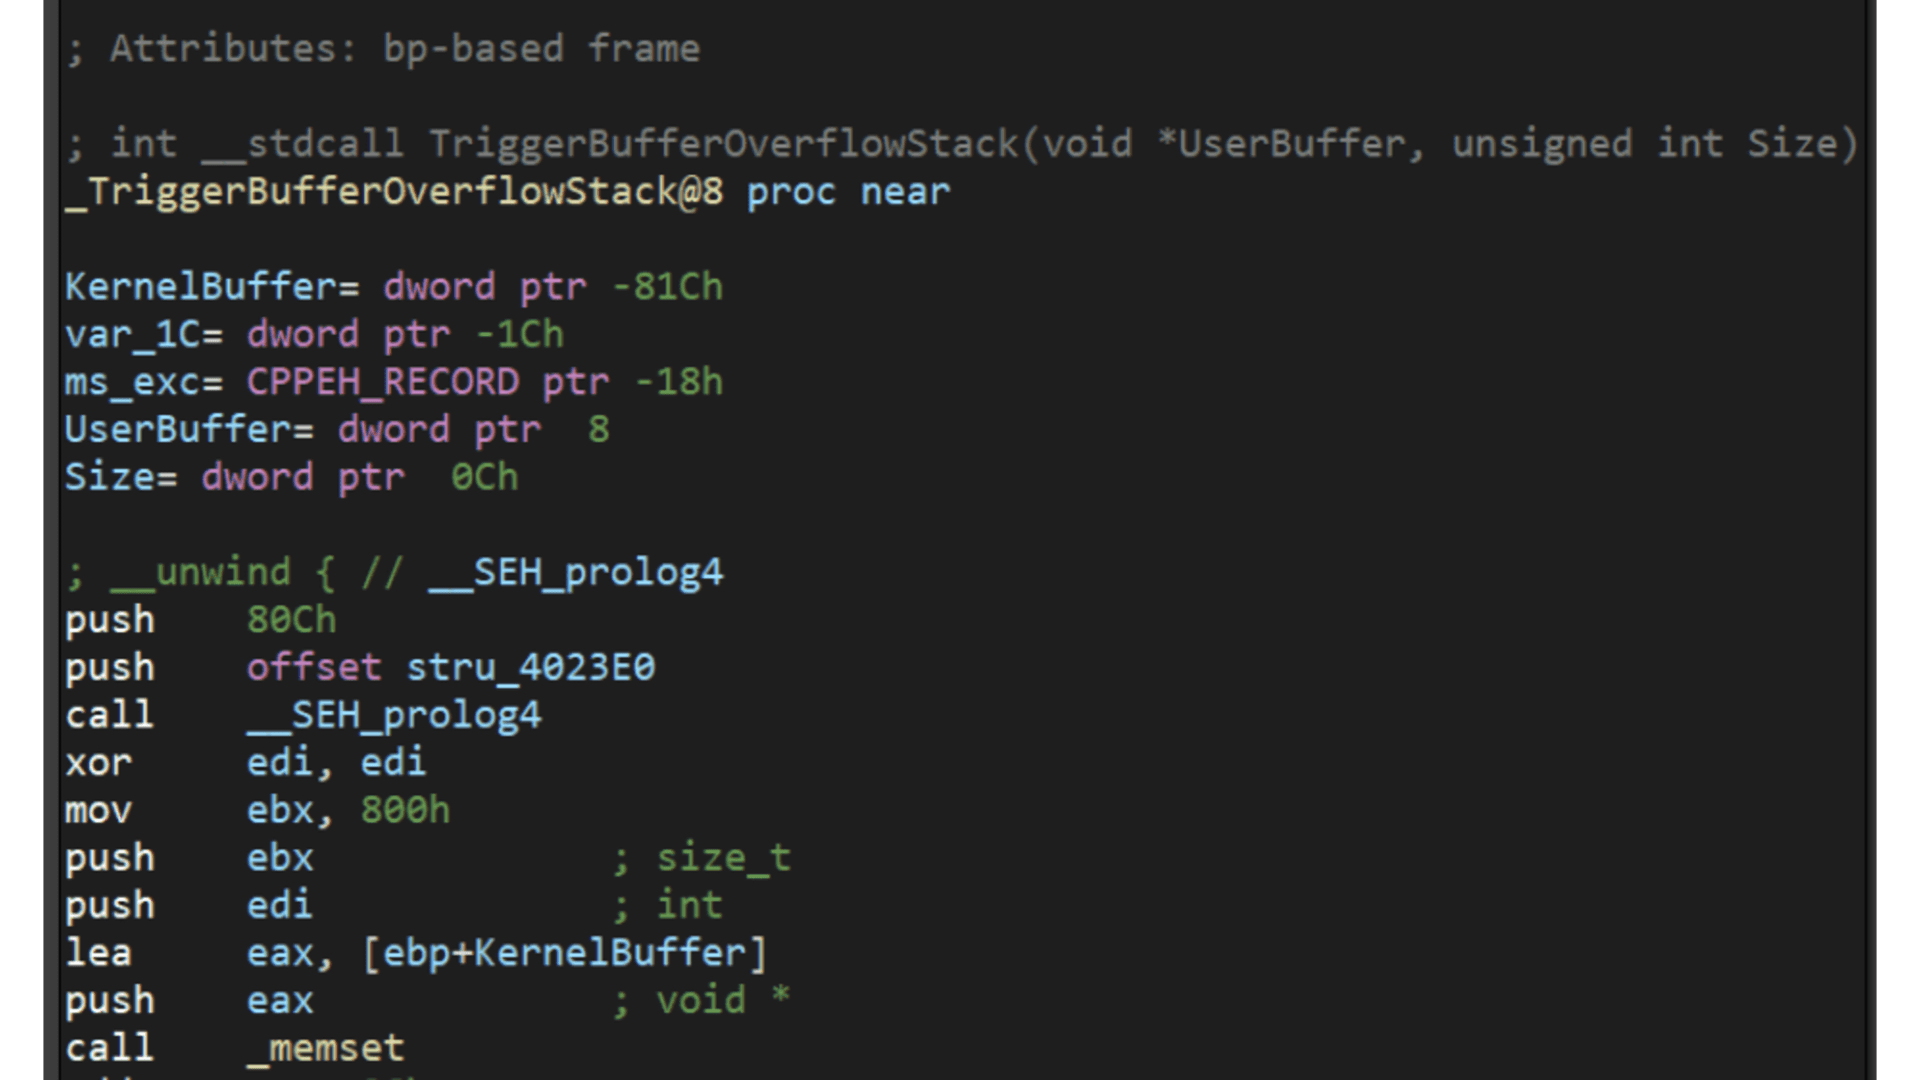
This indicates that the buffer is 800h or 2048 bytes long.
In the end of TriggerBufferOverflowStack, a call to memcpy(&KernelBuffer, &UserBuffer, SizeOfUserBuffer) is performed, which is a classic example of buffer overflow because we control both the UserBuffer data and the SizeOfUserBuffer value:

Great, it means that if we wanted to overflow the KernelBuffer variable, we should inject a payload with more than 2048 bytes, using the IOCTL code 0x222003. Let’s create our exploit:
And check it:

Great! We were able to overwrite EIP with our A buffer! Now the target machine is completely unusable and our DoS attack was successful.
Also, as we could evidence in our previous exploitation posts, we control the execution flow when we control EIP.
Conclusions
This post was intended to cover the first part for interacting with a Windows driver, and we were able to perform a full Denial of Service of the victim machine. In the next post, we will use the proven ability to control the execution flow to execute code at kernel-level.

Get started with Fluid Attacks' PTaaS right now
Related posts